2020 Silver Spring Housing Market Forecast

Table of Contents

The Silver Spring housing market isn’t the most expensive in the DMV area, not in comparison to Arlington or Fairfax counties (especially with Fairfax turning into Amazon’s new playground and Crystal City transforming into a new Amazon headquarters). Still, Montgomery County remains one of the richest counties in the United States, and Silver Spring itself has experienced a housing boom. 

Just ask anyone who lived in downtown Silver Spring before the arrival of the Discovery building. That cute shopping center on Ellsworth? That was a fenced-in grass patch. Nowadays, downtown Silver Spring has apartment buildings cropping up left and right. 

The question is: will Silver Spring’s housing boom last? And what does it mean for future home buyers and renters? Here’s what you need to know to make sense of the Silver Spring housing market going into 2020. 

Understanding the Silver Spring Housing Market

The Silver Spring housing market, like the rest of Montgomery County, is highly competitive. It contributed to suburban Maryland’s bipolar housing indicators in 2018, with housing indicators in Montgomery County moving in the opposite direction of neighboring Prince George’s County. Home prices rose in both counties in August 2018, but the gap between the two remains significant. 

Either way, sellers have the upper hand in Montgomery County (especially Silver Spring). It’s a seller’s market, with buyers paying 98% of the listing price and homes on the market for an average of just 17 days. 

Want to find out what your home is worth?
Get an instant market report sent straight to your inbox in seconds.

Average Home Price in Silver Spring MD

As with the rest of the DC suburbs, Silver Spring is pricey. It’s not the most expensive neighborhood in the DMV (that honor remains firmly with Georgetown, DuPont, and downtown Alexandria), but it’s not the most affordable neighborhood either. 

At the moment, the median listing price in Silver Spring is $442,450. That’s actually down from a price spike in August, which went almost up to the $460K range. 

If you’re new to the DMV and moving from somewhere far cheaper (like the Midwest, for example) take a deep breath. That might sound dizzyingly expensive, but for the area, it’s actually quite reasonable. 

A fair number of homes are priced higher than that, between $500K and $800K (keep in mind that real estate gets more expensive as you edge toward Bethesda). Again, it’s not cheap. In fact, compared to home values in the state and nation, it’s rather high. But for the DC area, it’s par for the course. 

The average rent in Silver Spring is around $1,684 for an average apartment size of 1,065 square feet (depending on apartment type). Given the DC housing market, that’s a lot of apartment space for a comparatively low price. 

Prices are so high because inventory is tight. Homeowners and renters aren’t moving if they don’t have to–largely because they’re worried they won’t be able to find another property for a comparable price with similar benefits. Plus, rising housing costs often mean that people who want to downsize wind up paying more if they move. 

Age and Type of Homes

Almost half of all homes in Silver Spring were built between 1940 and 1969. After that, 23.6% of homes were built between 1970 and 1999. 

Here’s the catch: buyer preferences in the area are shifting. 

These days, more buyers are seeking walkable neighborhoods, shorter commutes, and homes that require less renovation and maintenance. In short, they want homes that are more convenient and less expensive–better bang for their buck. The trouble is that most older houses require more maintenance. 

Plus, for those who work in the District or commute in from the suburbs, homes within the Beltway loop are more attractive. Homes in car-oriented communities aren’t moving as fast among a buyer population that increasingly prefers public transportation. 

In addition, the market is heavily skewed toward renters, which makes sense considering that only 37% of Millennials are buying houses. In fact, homeownership has fallen to its lowest rate in five decades

Between incredibly high Millennial student debt and expensive real estate markets like DC, young people of the home-buying age are opting for affordable housing options (well, more affordable for the area, anyway). More than half of all homes in Silver Spring are apartment complexes, which makes sense considering that more than half of the population rents instead of buying a home. 

What’s Selling and What’s Not

By and large, the Silver Spring housing market forecast is a question of supply and demand. In this case, low inventory is a self-fulfilling prophecy. 

Homeowners and renters are wary of moving because they don’t think they can find a home they can afford. But when the whole market thinks this way, homes and apartments are out of circulation, keeping the market inventory low and the market firmly in favor of sellers.

In addition, extremely low mortgage rates hold homeowners back from selling. And while apartments are appearing as if by magic in downtown Silver Spring, the construction of new single-family homes has not kept up with the demand (in keeping with a nationwide trend). Most of the new construction is focused on new high-rises in downtown Silver Spring. 

Good news for renters…not so much for homebuyers. 

Looking for Housing in the DMV?

All told, the Silver Spring housing market is hale and healthy. And if you’re a buyer, that’s good news. But you have to know what you’re looking for and where to find it. 

That’s where we come in. 

We have over a decade of experience in sales and leasing. We know the DMV housing market, and we’re here to help revive the housing market in favor of buyers like you. 

Want to find out what makes our approach unique? Click here to learn more about how we can help you find, buy, sell, or manage the perfect property in the DC area. 

Share via Email
Share on Facebook
Share on LinkedIn
Share on Twitter
Get help from DC's top real estate team.
Founded in 2005, Nomadic is the go-to full service real estate firm in the DMV. We've helped thousands of landlords, investors, and residents and we would love to connect with you next.

Check out more of our blog posts below!

Or search for a different topic:

Scroll to Top

Thinking of selling? Get an instant property value report:

Enhanced Reporting

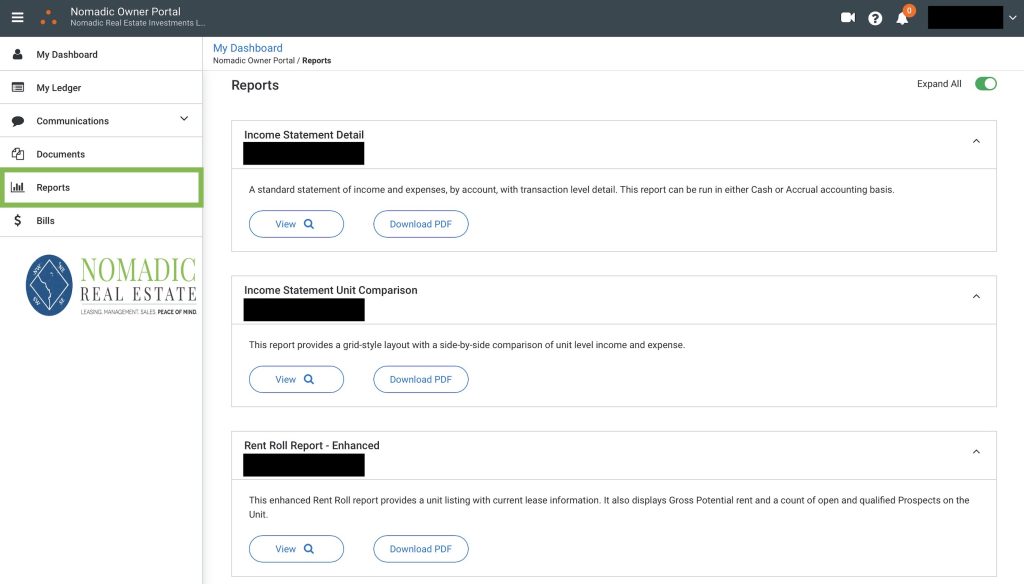
Your portal includes a selection of extremely useful reports. Reports are available in the “Reports” section, and are distinct from the financial statements. Unlike financial statements which are static records, Reports are dynamic real-time records that will update with current data every time you view them. 

Scroll down to learn more about Reports:

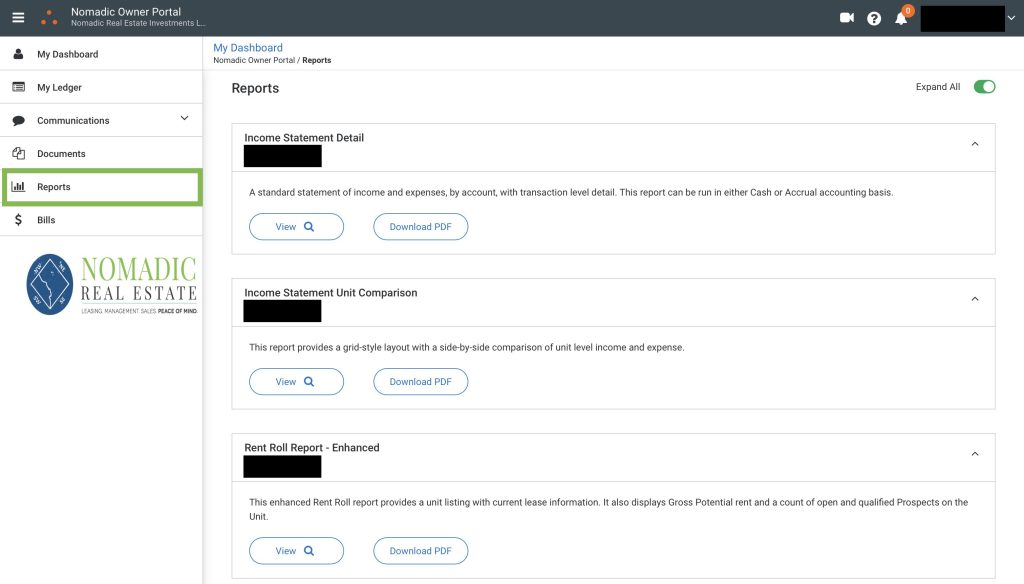
Navigate to the "Reports" module in your portal:

Owner Portal Reports
  • Keep in mind, these reports are dynamic records. They will refresh to display current information every time you view them. 

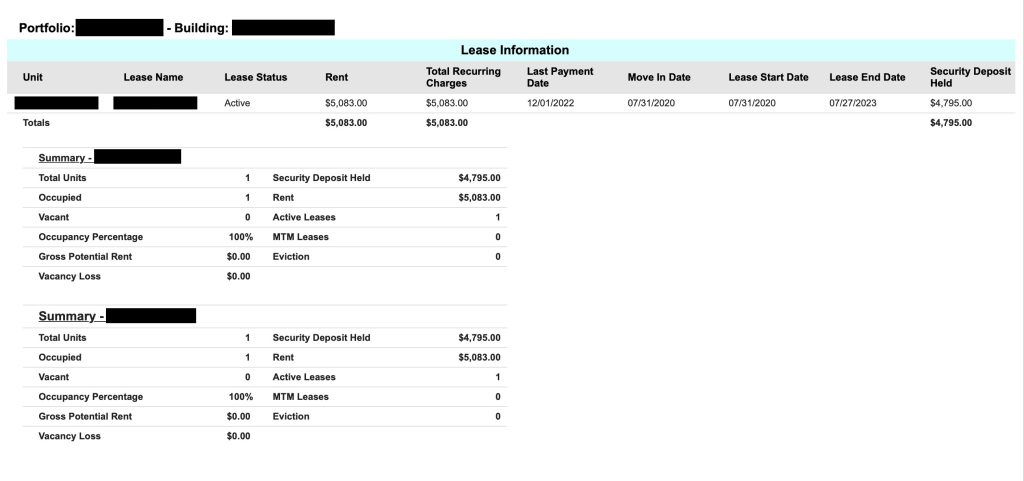
Enhanced Rent Roll Report:

Enhanced Rent Roll Report
  • The Enhanced Rent Roll Report will show the rent amount, last payment date, move-in date, lease expiration date, and security deposit amount for each of your tenants. 
  • It will also show a portfolio summary with occupancy percentage, vacancy loss, and more!

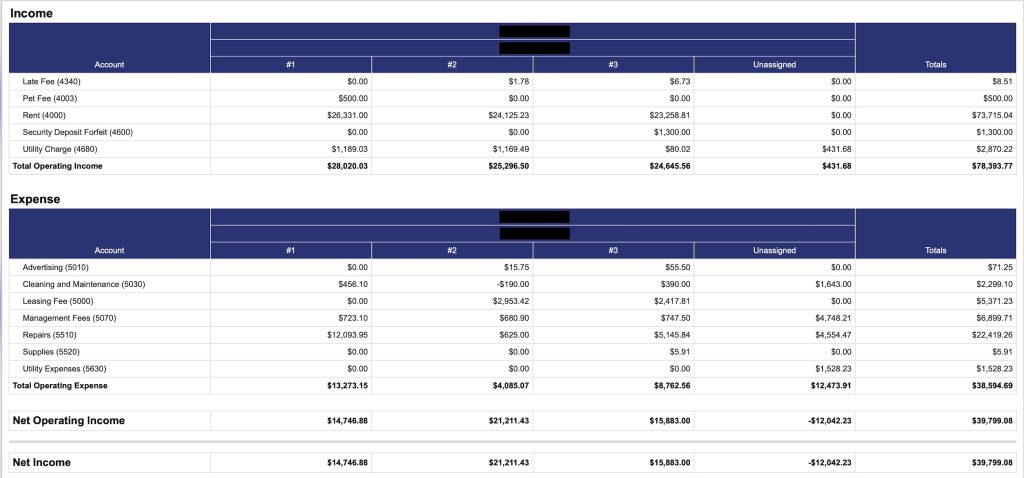
Unit Comparison Report:

Unit Comparison Report
  • If you own multiple units (or buildings) with Nomadic, you’ll get access to the Unit Comparison Report. 
  • This report enables you to quickly compare financial performance between your units at a glance without toggling between individual reports. 

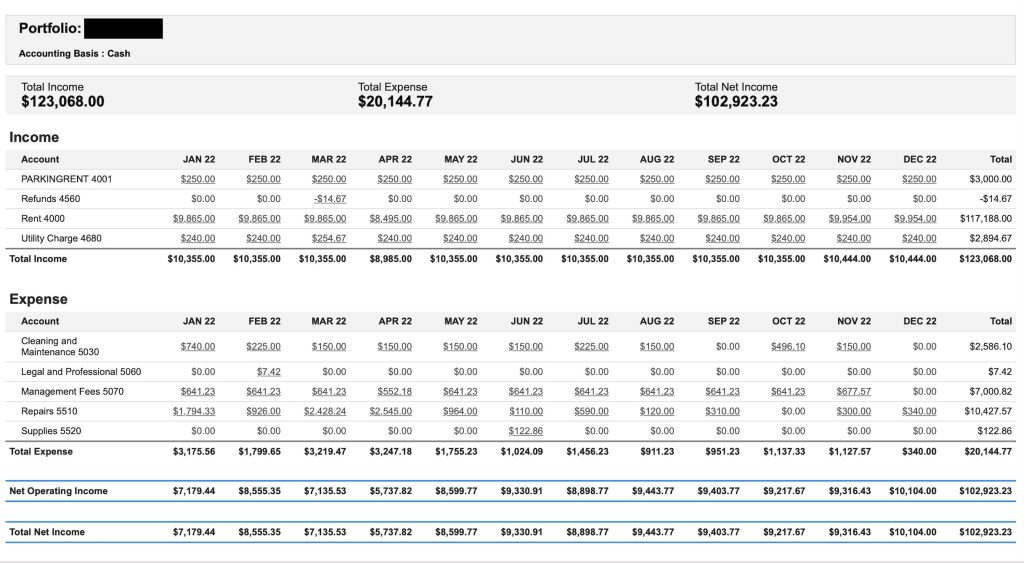
Income Statement Month-Over-Month:

Income Statement by Month Report
  • The Income Statement Detail – Monthly Report serves as a month-over-month record of portfolio performance. You’ll see itemized income and expense categories and can track monthly. This report will update with fresh data every time you view it. 

Financial Statements

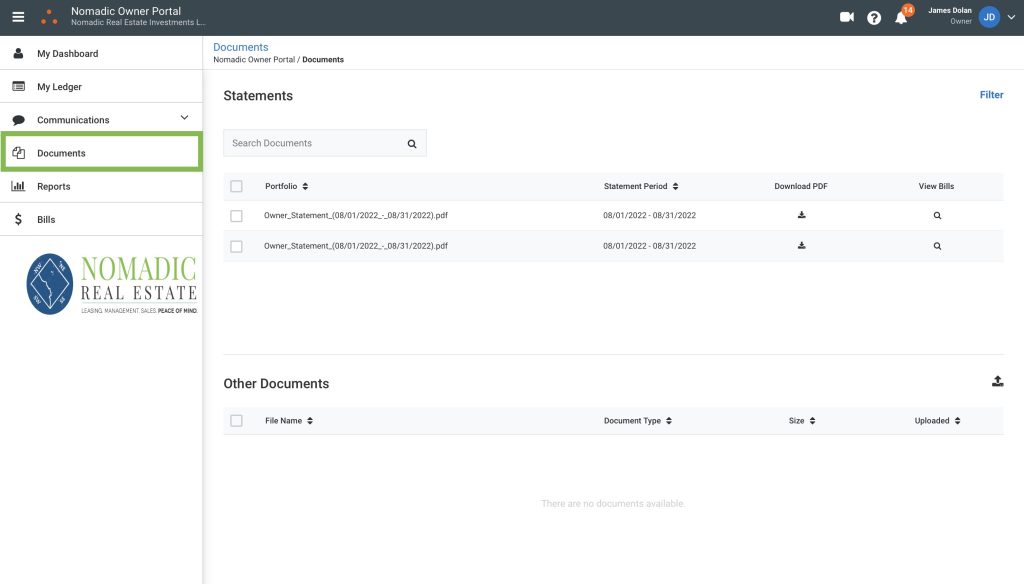
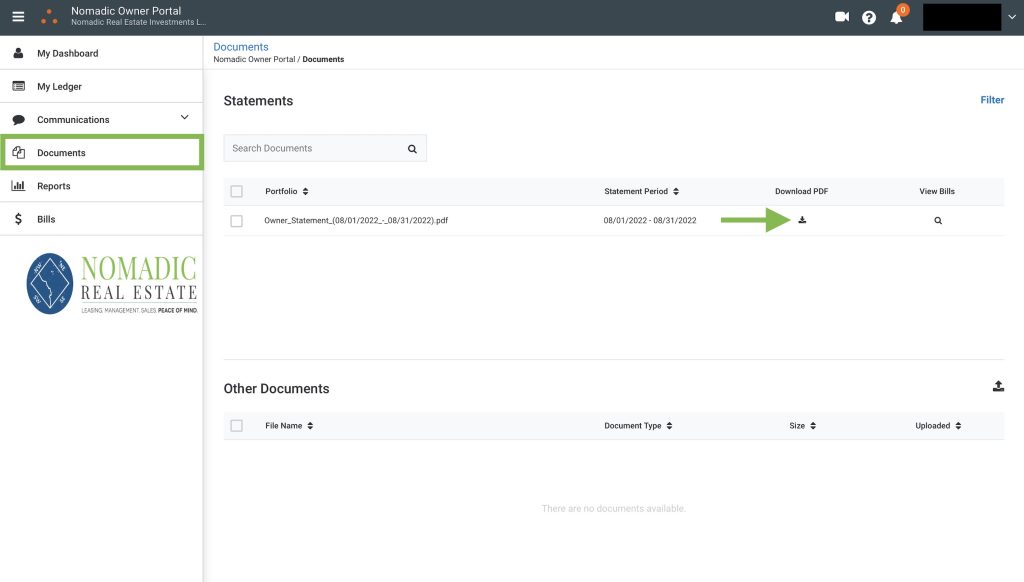
Financial statements will be published to your portal on a monthly basis. The statements are found in your Documents library, and provide a historical record of all financial performance. The statements serve as a snapshot of financial performance over a given period, and are static documents (unlike Reports, the statements do not update/change in real-time). 

Scroll down for more info about the Financial Statements in your Documents library:

The Documents area contains monthly financial statements:

Owner Portal Documents
  • The statements in the Documents are are static documents. They are posted to the portal once a month to serve as a historical record of financial performance. 

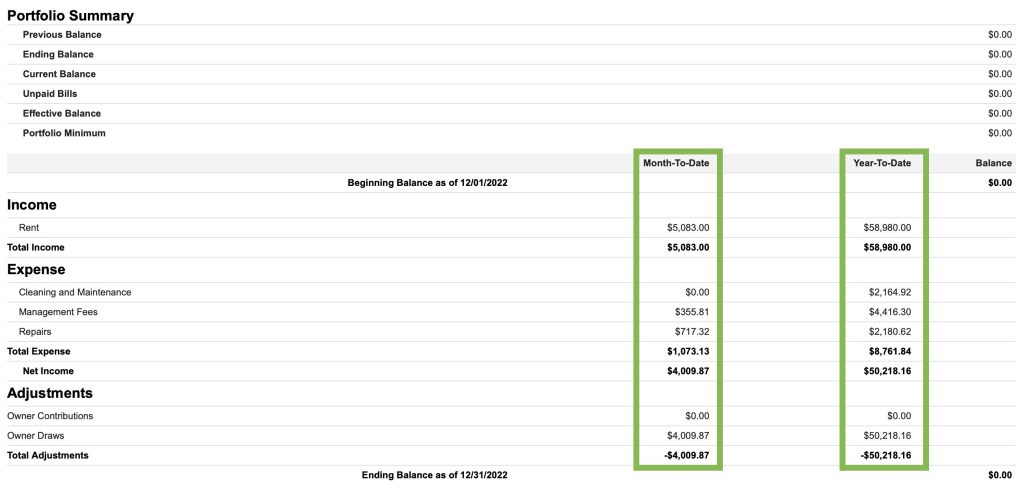
Download a statement to see month and YTD financials:

Owner Portal Property Statement

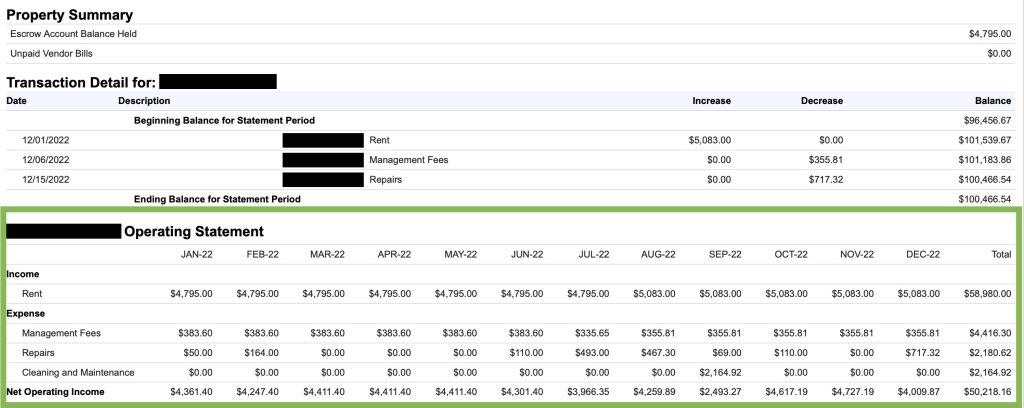
You'll also find a month-over-month operating statement:

Month over Month Statement

Portal Communication Tool

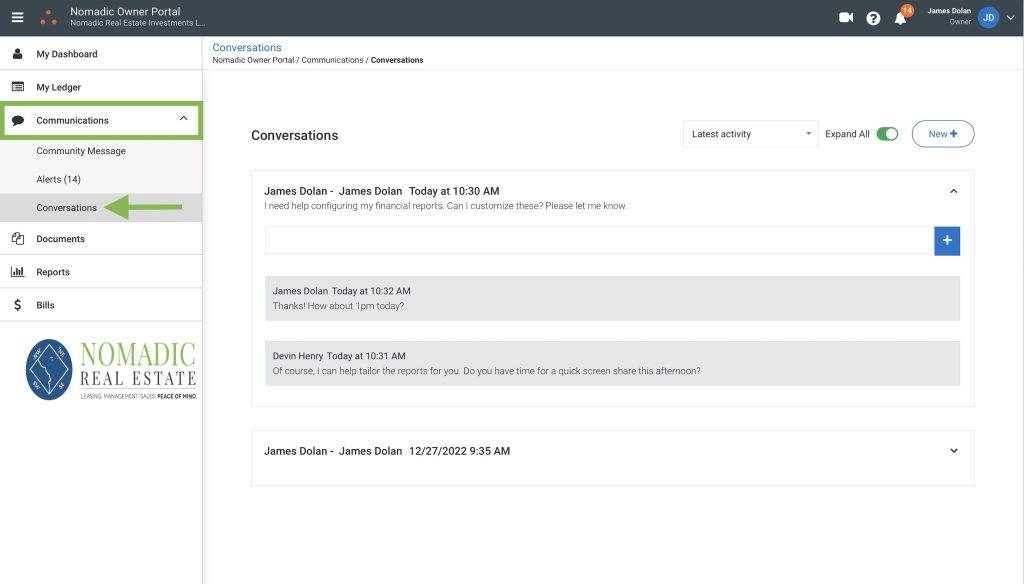
You can use your owner portal to communicate with our team. Any messages you send through the portal will go straight to your Account Manager. When we reply, you’ll get an email notification and you’ll also see the message in your portal next time you log in. 

Here’s an overview of using the communication platform:

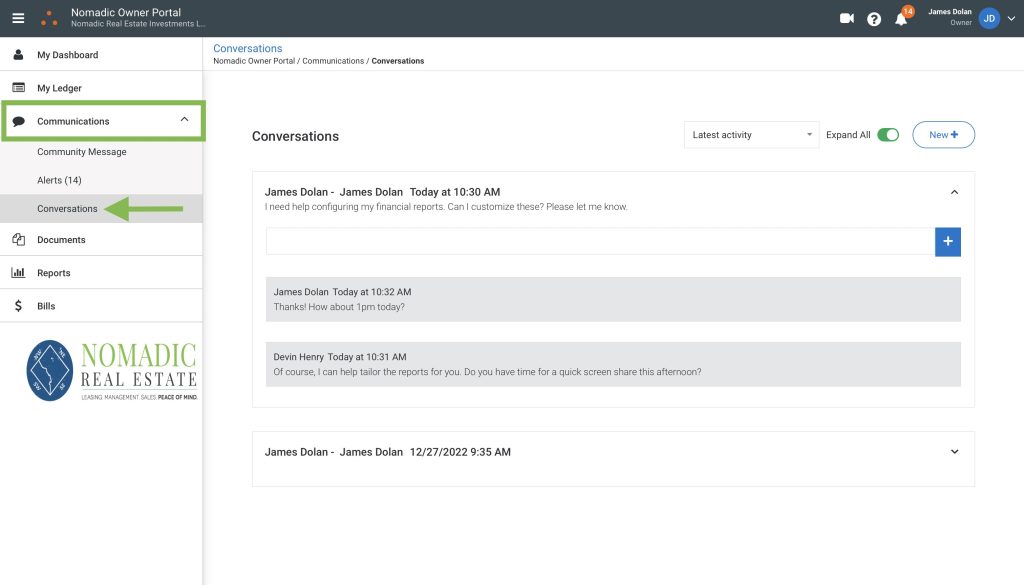
Click "Communications" and navigate to "Conversations":

Commincation Dashboard Screenshot
  • The communications module will contain a record of all messages that you create through the portal. 

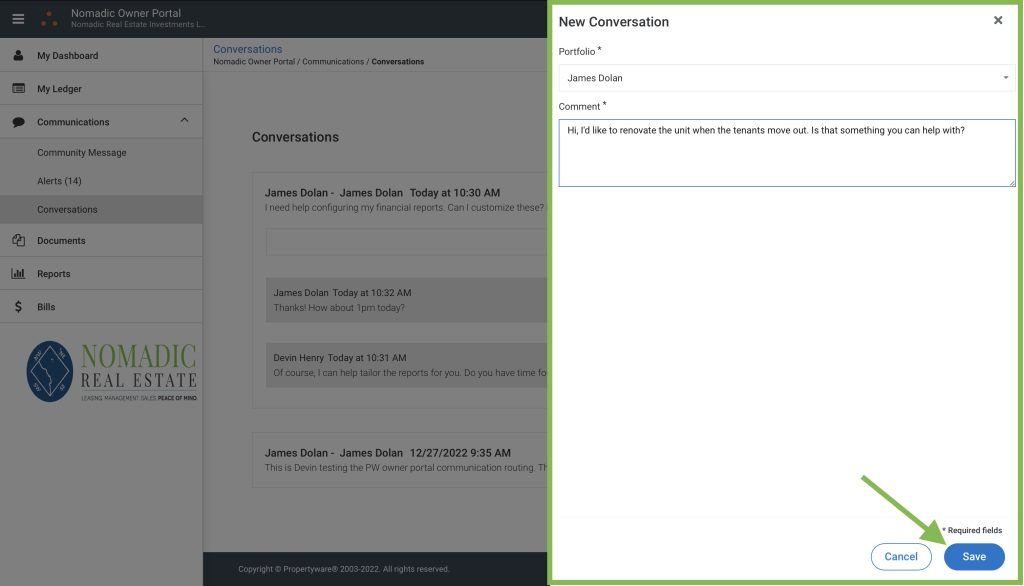
Click the "New Message" button and send your message:

Owner Portal New Message Screenshot

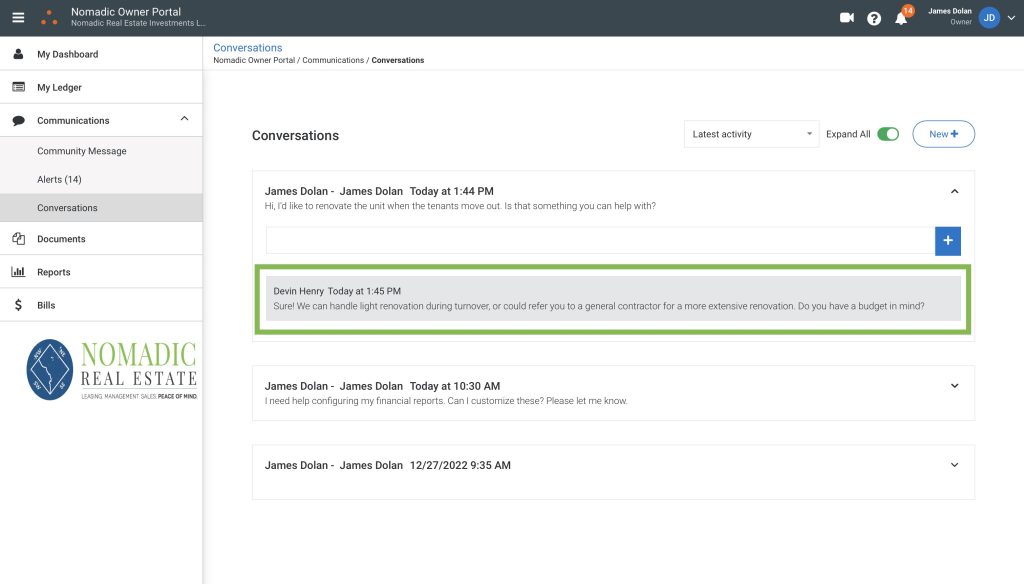
Responses will show up in the conversation ticket:

Portal Conversation Response Screenshot
  • You’ll get an email notification whenever you get a response, and you’ll also see the message in your portal next time you log in. 

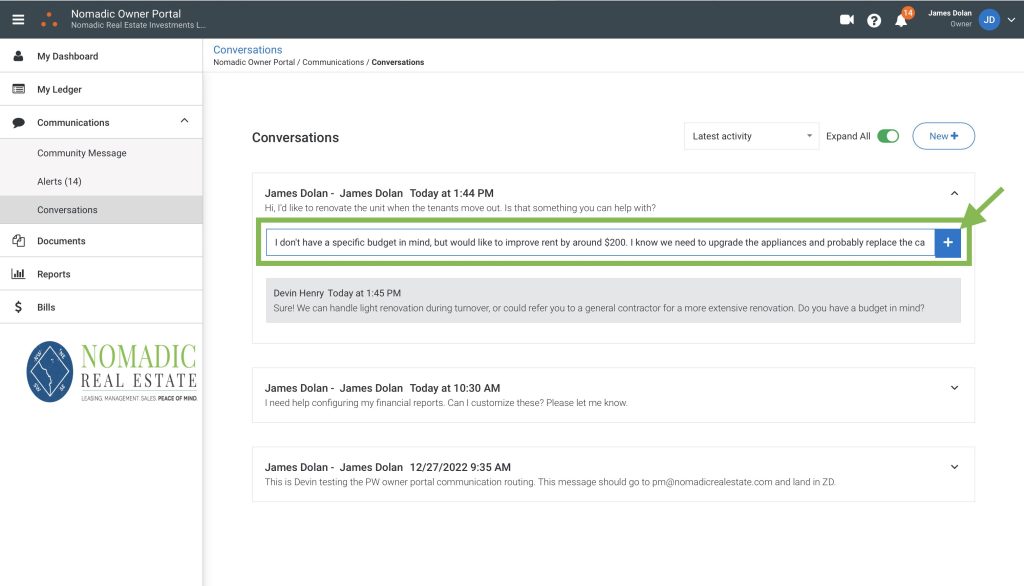
You can reply in-line using the comment box:

Owner Portal Comment

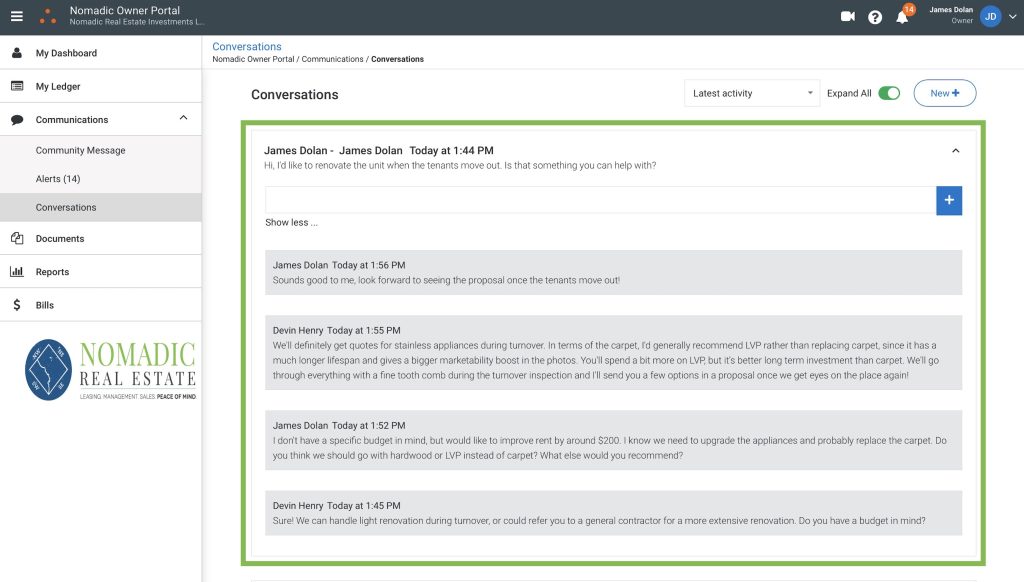
Each conversation will be logged in its entirety:

Portal Conversation Snapshot

Understanding the Ledger

Your portal includes a ledger with all transactions. The ledger is populated with data in real-time as transactions flow through our accounting software. Much of this information is also available in the Reports area, as well as the Statements in your Documents library, but the ledger is the most comprehensive resource for diving into the details. 

Please scroll through the sections below to get a better understanding of how to interpret the ledger. 

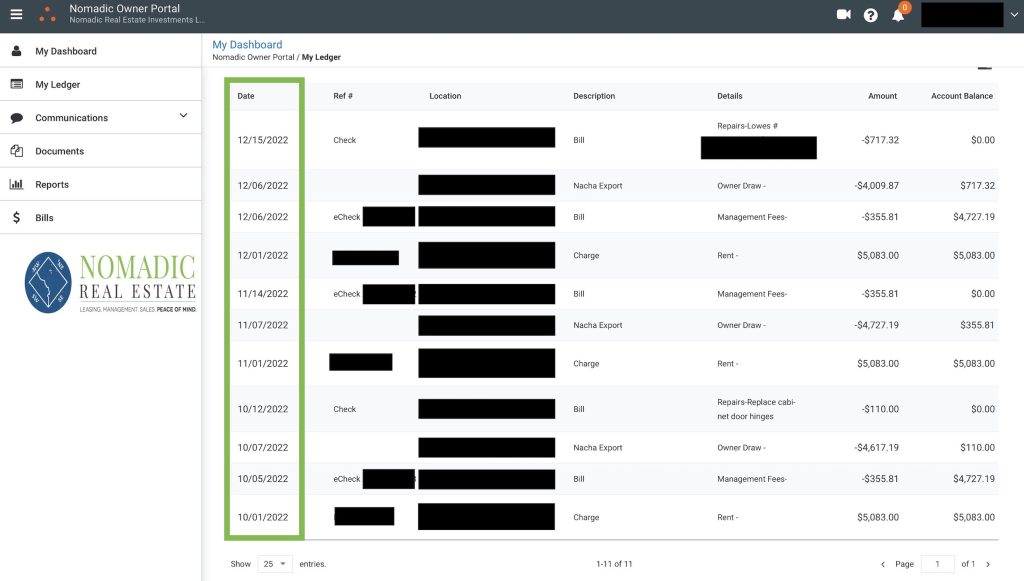
By default, transactions are sorted chronologically:

Owner Ledger Dates
  • The date reflected in the lefthand column is the actual transaction date, not the “bill date”. This is the date the transaction was actually processed. 

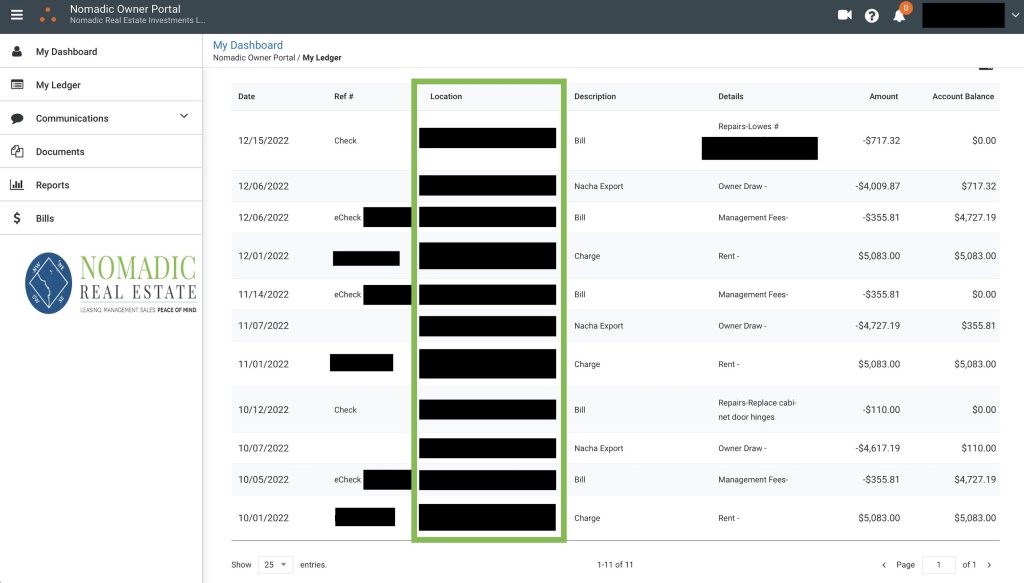
If you have multiple properties with Nomadic, you'll see the address for each transaction in the "Location" column:

Ledger Property Column
  • You can filter the ledger to look at just one property, all properties, or specific sets of properties. 
  • If you only have one property with us, you’ll just see the ledger for that property. 

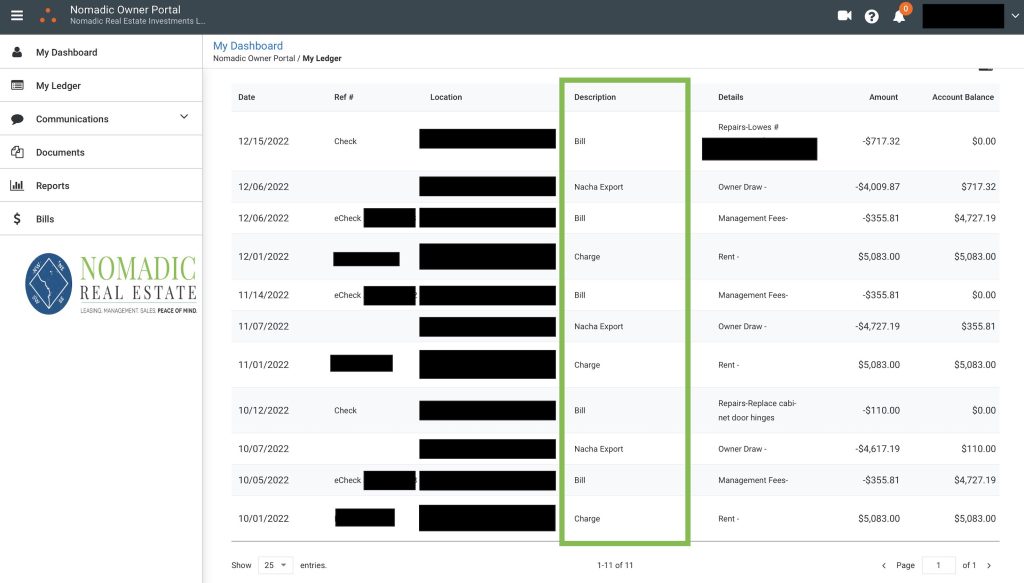
The Description column displays the transaction type:

Owner Ledger Description Column
  • BILL: this is an expense transaction, such as for repair costs or management fees.
  • CHARGE: this is a transaction  billed to the tenant, most typically a rent payment. 
  • NACHA EXPORT: this is a credit we processed to your distribution account. This type of transaction is how you get paid! 

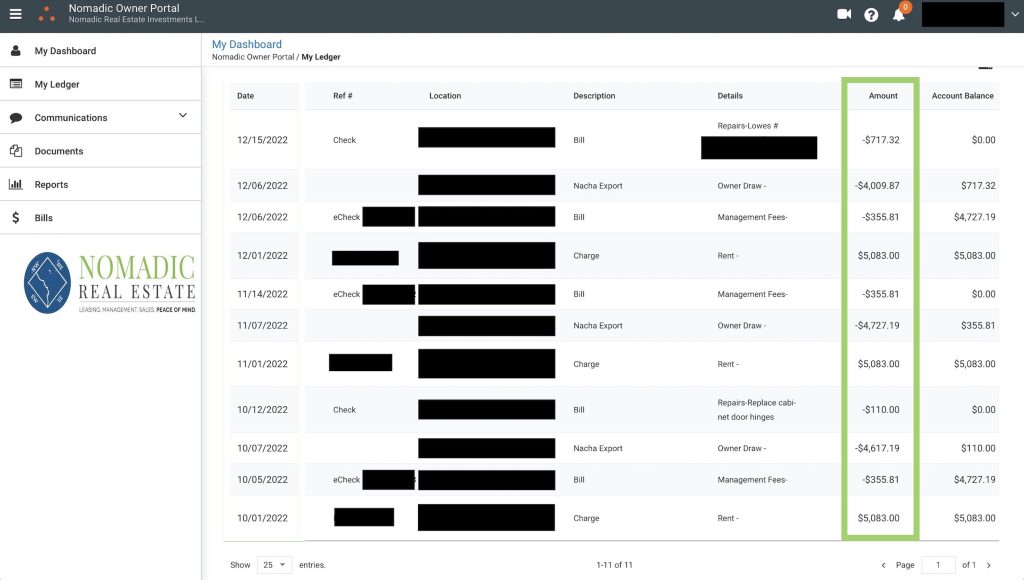
The Amount column shows the dollar value of each transaction:

Owner Ledger Amount Column
  • Positive Amounts: if an amount is positive, it reflects a transaction that is payable to you. Typically, this will be a rent payment that we collected from your tenants. On occasion, a positive number could also signify a journal entry or credit adjustment. 
  • Negative Amounts:  if an amount is negative, this is a transaction that is either payable to Nomadic or is an amount that has already been paid to you. Typically this will be for repair costs or management/leasing fees. Owner draws (net distributions into your checking/savings account) also reflect as negative amounts, since they have already been paid to you. 

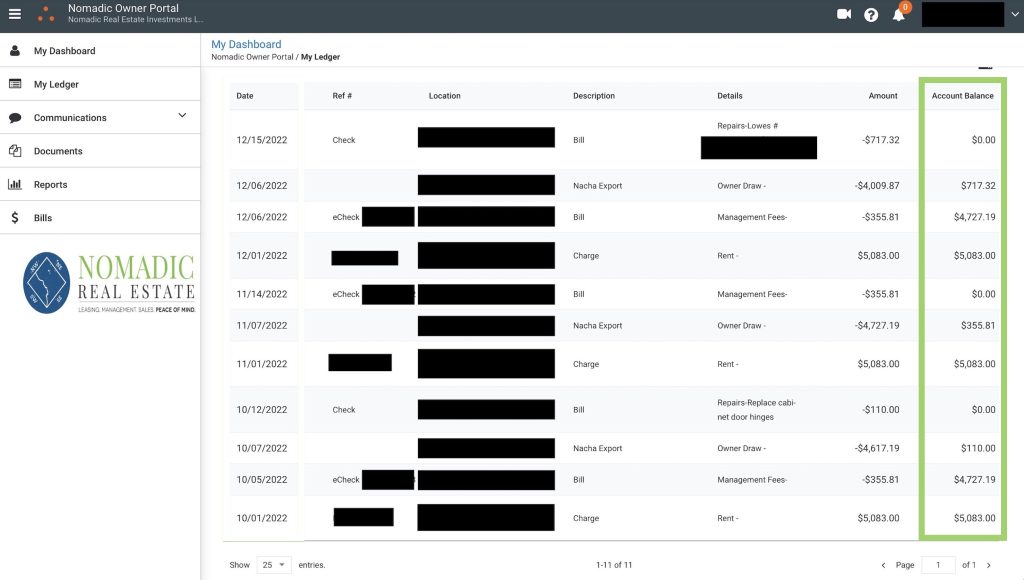
The Account Balance column shows a sum of positive/negative transactions at a given point in time:

Owner Ledger Account Balance Column
  • Account Balance should always equal zero after a net distribution has been processed. When the balance is zero, this means that all expenses have been paid and you’ve received the remainder as net operating income, leaving a balance of zero (meaning: no one is due any money, as all funds have been distributed appropriately). 

Navigating the Propertyware Owner Portal

Your portal includes some extremely useful features that help you understand your property’s financial performance at a new level, with real-time transparency into every transaction.

Scroll through the snapshots below for an overview of portal navigation! If you need more help or have specific questions about using the portal, you can reach out to your Account Manager any time for a screen share. 

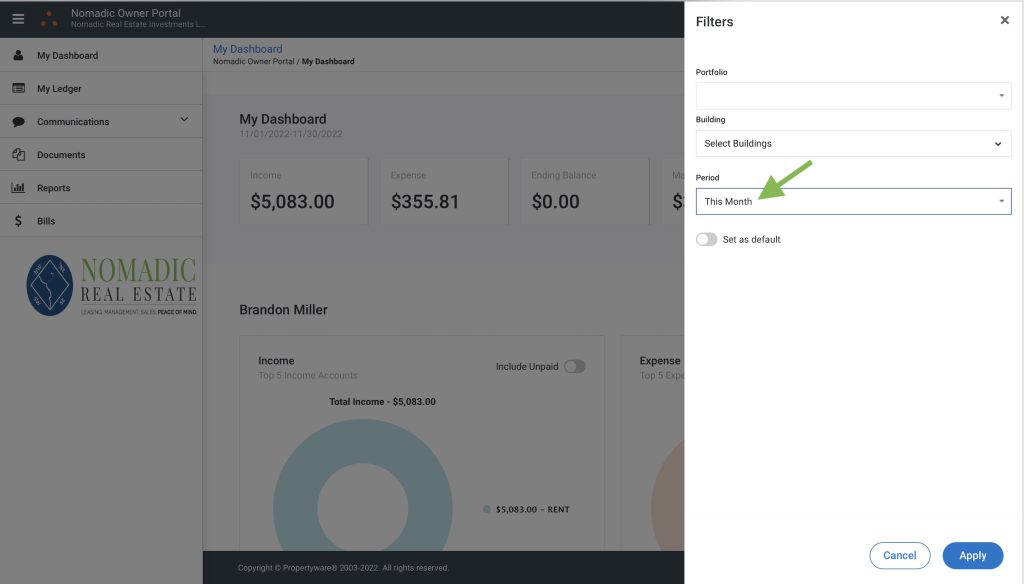
You can filter all info by date range or property:

PW Portal Filters

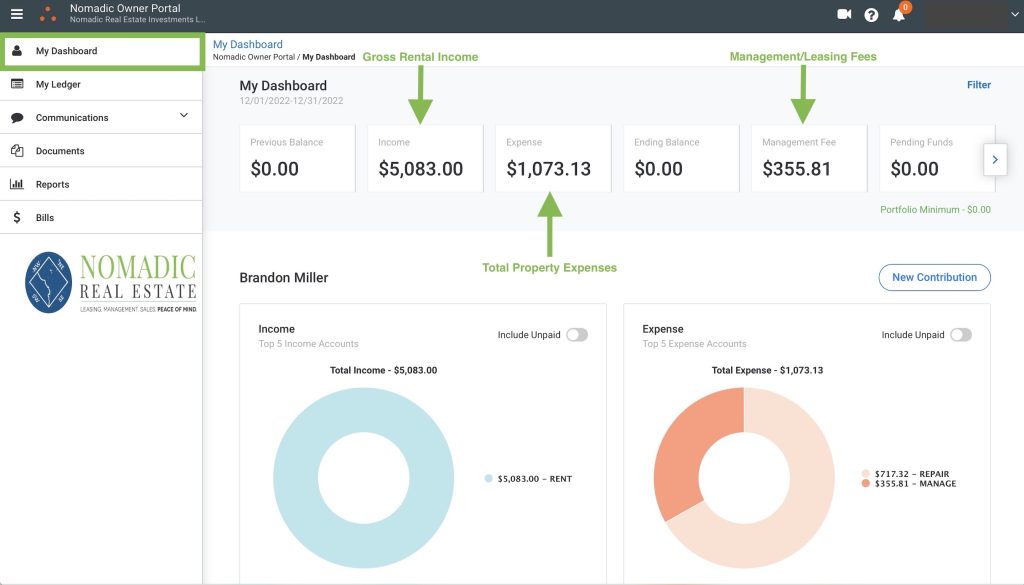
View a snapshot of income and expenses on your dashboard:

PW Owner Dashboard View

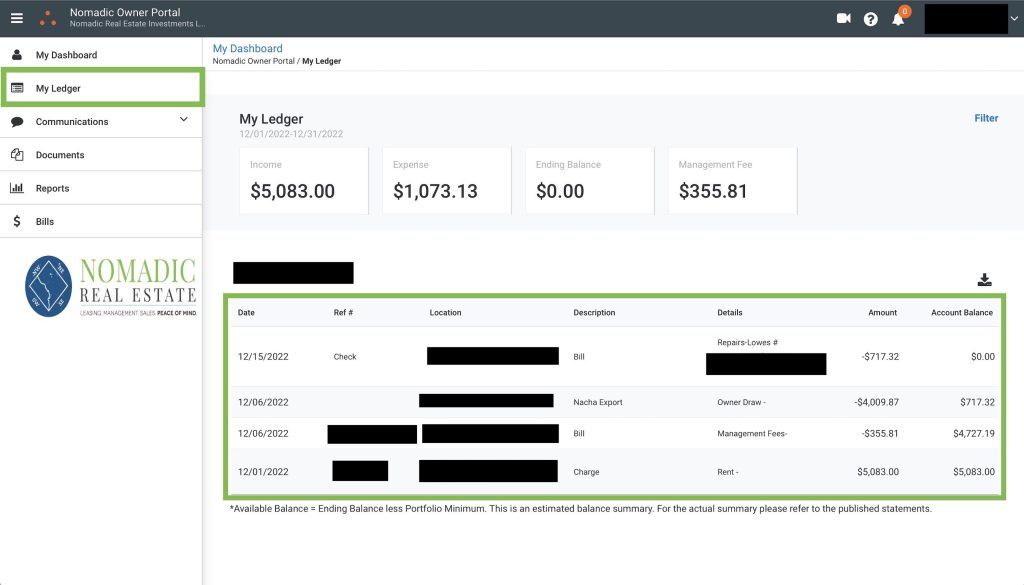
See every transaction in real-time on your ledger:

Owner Portal Ledger View

Statements and forms will be posted to your documents library:

Owner Portal Document Library

View a suite of real-time financial reports:

Portal Reports View

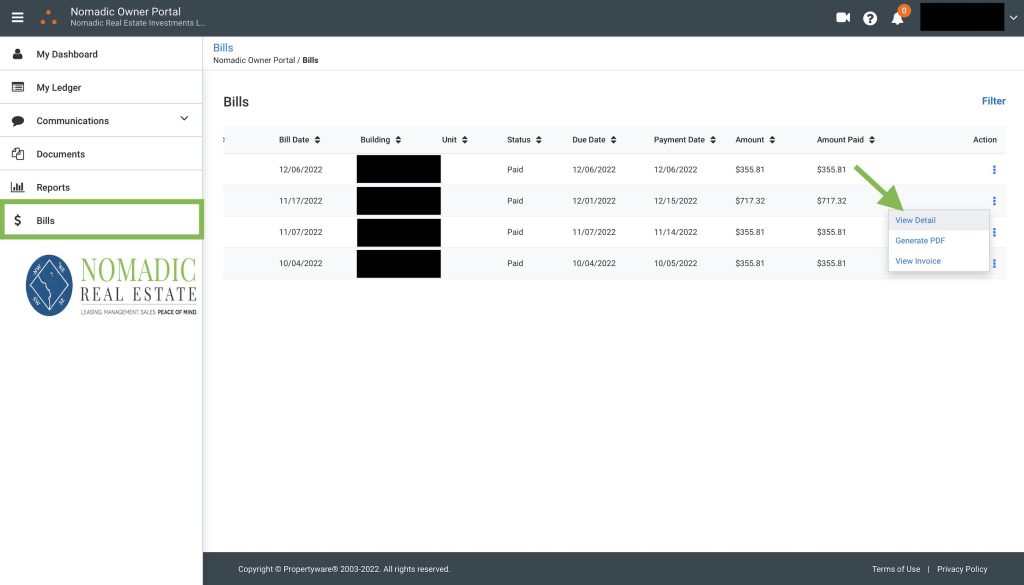
See a running list of all bills, and drill down for more detail:

Owner Portal Bills View

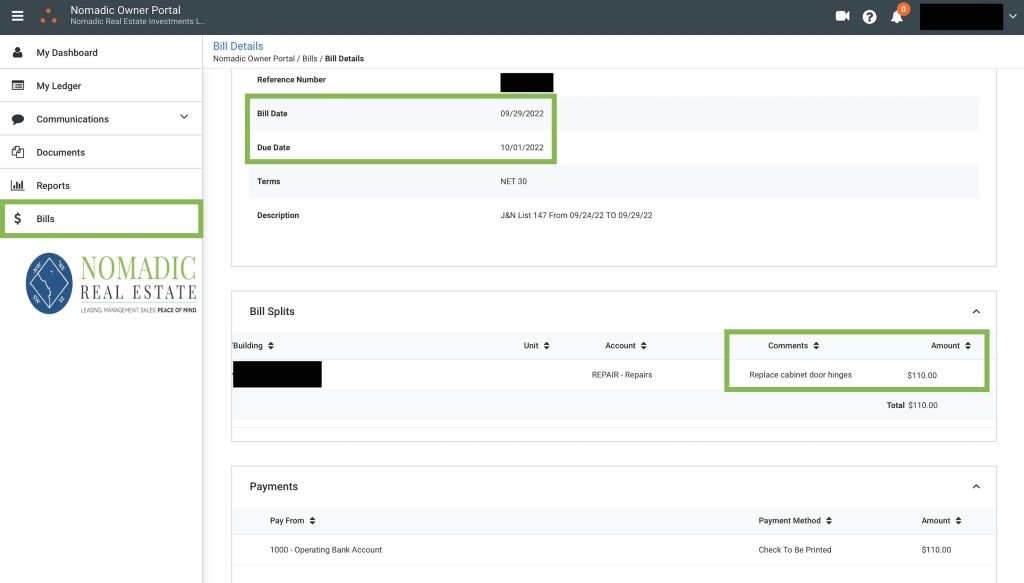
Under Bill Details, you'll find dates/descriptions/amounts and more:

Portal Bill Details

You can also communicate with your Account Manager through the portal:

Owner Portal Communication Tools

How do net distributions work?

Net distributions keep your accounting clean and simple. Each month we’ll collect rent from the tenants, deduct any repair expenses for the previous month and any management/leasing fees for the current month, and credit the remaining net operating income to your account. 

Net Distribution

You’ll receive a statement via email each time a net distribution is processed, and can view all transaction details in your Propertyware owner portal.