Alexandria VA Housing Market Forecast in 2019

Table of Contents

There is a lot of buzz about Alexandria’s housing market in 2019. The more popular term used to describe this spike in the market is the “Amazon effect.” So, in case you are moving into this new tech-jungle of the world, here’s what you need to know. 

Things are changing, and they are changing fast this year. Amazon’s recent monumental investment in the area caught the nation’s eye, leaving many to speculate about how it might influence Alexandria’s housing market. In this article, we are going to examine the stats and facts behind the housing prices in the historic city of Alexandria, which rests on the edge of the Potomac River, a short distance from Capitol Hill. 

Let’s paddle through the waters together and hit the shore facts about what is causing such a stir regarding Alexandria’s housing market. To do this, we will explore what Redfin, Zillow, and Long and Foster have to say about the current housing market trends in this 300-year old city right outside the Nation’s capital. 

alexandria's housing market

Redfin Stats 

Alexandria scores in at 96 percent most competitive rating on this popular home search site. According to the Redfin stats, sale prices for homes on average have gone up by 1.9 percent since last year. They calculate the median price of a home to be 493k. The impact on the local economy Amazon will have is bound to raise home values in Alexandria’s housing market, so there is a possibility we could see prices increasing at an even more rapid rate in the future.  

Their average price per square foot for a home in Alexandria comes in at 298 dollars, which is up by 4.2 percent since last year. 

They estimate that homes usually sell at a 2 percent above listing price range and go pending in an average of three days. Most homes receive two or more offers before sold. 

  • Median Home Price: 493k 
  • Median Square Foot Price: $298 

Let’s see what Zillow has to say about all of this. 

Zillow Stats

Zillow definitely sees Alexandria’s housing market a bit differently. Their data does not seem as comprehensive as Redin’s and their predictions show a difference in the average sale of a home. The difference in data can still inform our understanding of Alexandria’s house market.

Their median sale price of a home weighs in at 504k, and their average price per square foot is calculated at $399. Unlike Redfin, Zillow also offers a median rent price coming in at 2,492 dollars a month. These are significant differences in comparison with Redfin, and there is no information on the average time it takes for a home to go pending. Zillow, on the other hand, skips out of the average sale price comparison from 2018. Let’s evaluate.

  • Median Home Price: 504k
  • Median Square Foot Price: $399
  • Median Rent Price: $2,492

Alright, it’s time to check out our next source and see if we can better predict what influence Amazon will have on Alexandria’s housing market.

Want to find out what your home is worth?
Get an instant market report sent straight to your inbox in seconds.

Market Minute by Long and Foster 

Long and Foster has a very in-depth data analysis system for the current market trends in Alexandria this year. Their stats show a 6 percent increase in home values since last June, and they rate the median price of a home in Alexandria at 512k. 

The stats also show that there has been a 5 percent decrease in the number of homes on the market. The average time a home sat on the market this year is 27 days, which is higher than the average last year, that came in at 23 days. 

  • Median Home Price: 512k

So What’s the Forecast For Alexandria’s Housing Market?

From the data gathered, it seems that there are a lot of stats going around. The overall takeaway is that housing prices are going up in Alexandria, VA, and they will probably continue to do so considering the great location and influx of new jobs.

Why move to Alexandria? Find out more in this article about moving to Alexandria

But to really be in the know on this historic city you should talk with a professional at Nomadic Real Estate. They know the ins and outs of renting, buying, selling, or managing a property in the area and how they will help you get the best deal in town!

Share via Email
Share on Facebook
Share on LinkedIn
Share on Twitter
Get help from DC's top real estate team.
Founded in 2005, Nomadic is the go-to full service real estate firm in the DMV. We've helped thousands of landlords, investors, and residents and we would love to connect with you next.
Scroll to Top

Enhanced Reporting

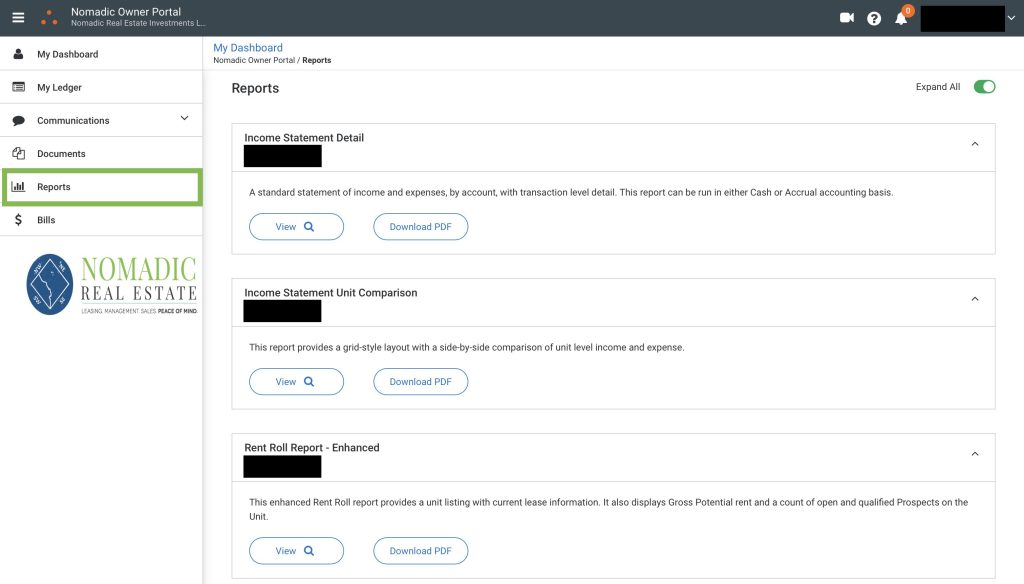
Your portal includes a selection of extremely useful reports. Reports are available in the “Reports” section, and are distinct from the financial statements. Unlike financial statements which are static records, Reports are dynamic real-time records that will update with current data every time you view them. 

Scroll down to learn more about Reports:

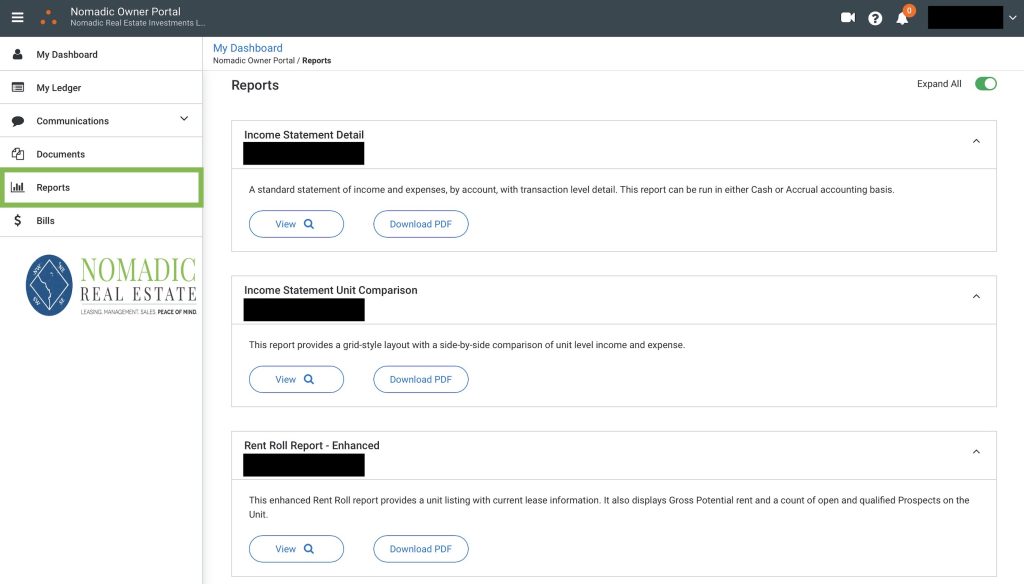
Navigate to the "Reports" module in your portal:

Owner Portal Reports
  • Keep in mind, these reports are dynamic records. They will refresh to display current information every time you view them. 

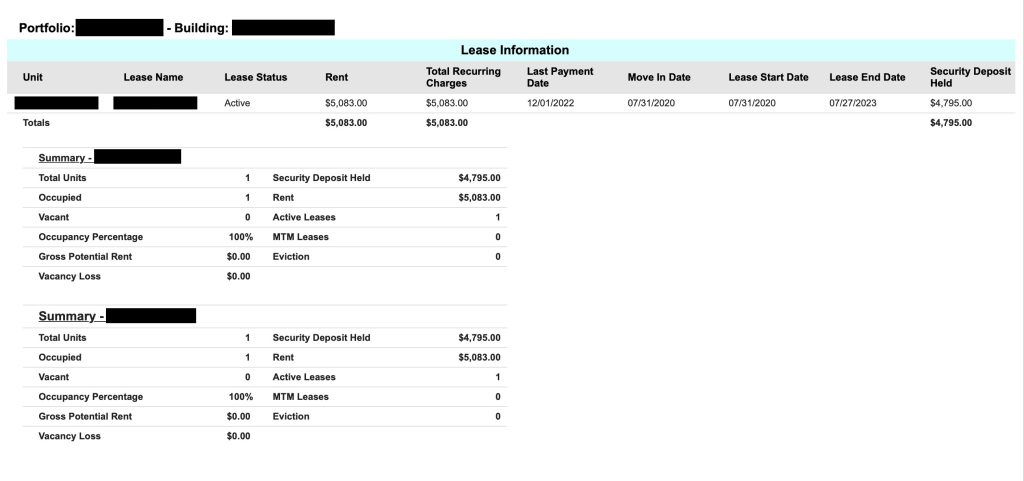
Enhanced Rent Roll Report:

Enhanced Rent Roll Report
  • The Enhanced Rent Roll Report will show the rent amount, last payment date, move-in date, lease expiration date, and security deposit amount for each of your tenants. 
  • It will also show a portfolio summary with occupancy percentage, vacancy loss, and more!

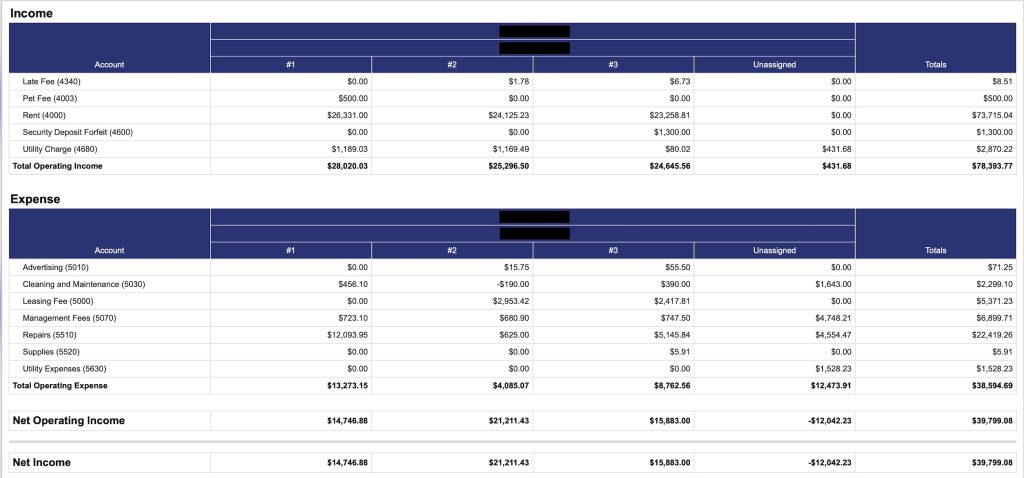
Unit Comparison Report:

Unit Comparison Report
  • If you own multiple units (or buildings) with Nomadic, you’ll get access to the Unit Comparison Report. 
  • This report enables you to quickly compare financial performance between your units at a glance without toggling between individual reports. 

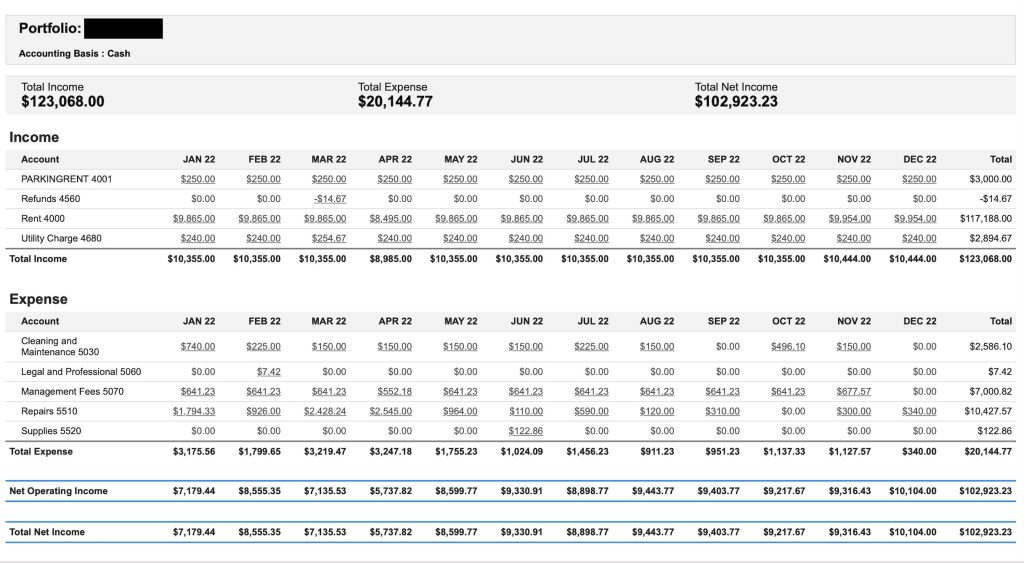
Income Statement Month-Over-Month:

Income Statement by Month Report
  • The Income Statement Detail – Monthly Report serves as a month-over-month record of portfolio performance. You’ll see itemized income and expense categories and can track monthly. This report will update with fresh data every time you view it. 

Financial Statements

Financial statements will be published to your portal on a monthly basis. The statements are found in your Documents library, and provide a historical record of all financial performance. The statements serve as a snapshot of financial performance over a given period, and are static documents (unlike Reports, the statements do not update/change in real-time). 

Scroll down for more info about the Financial Statements in your Documents library:

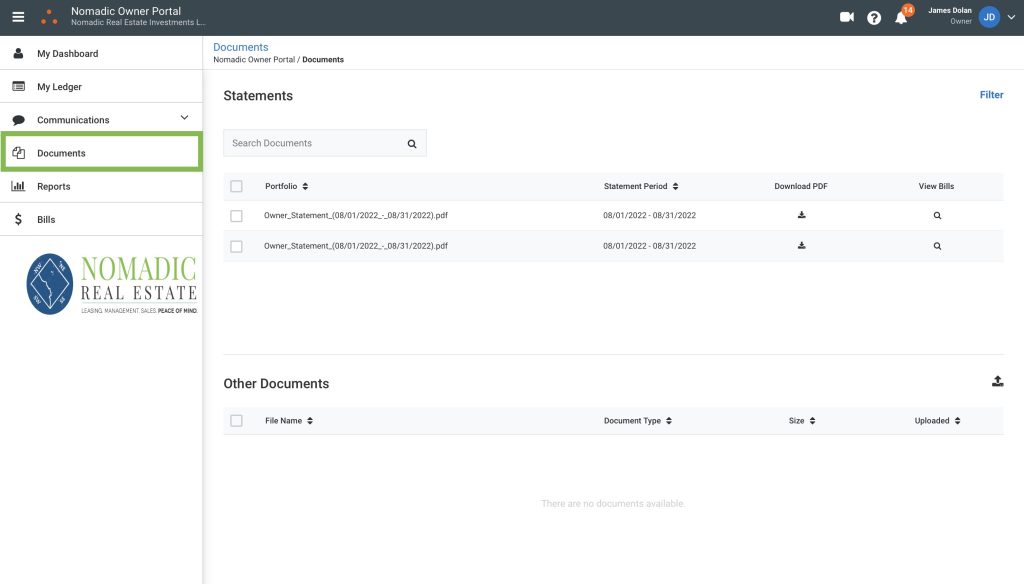
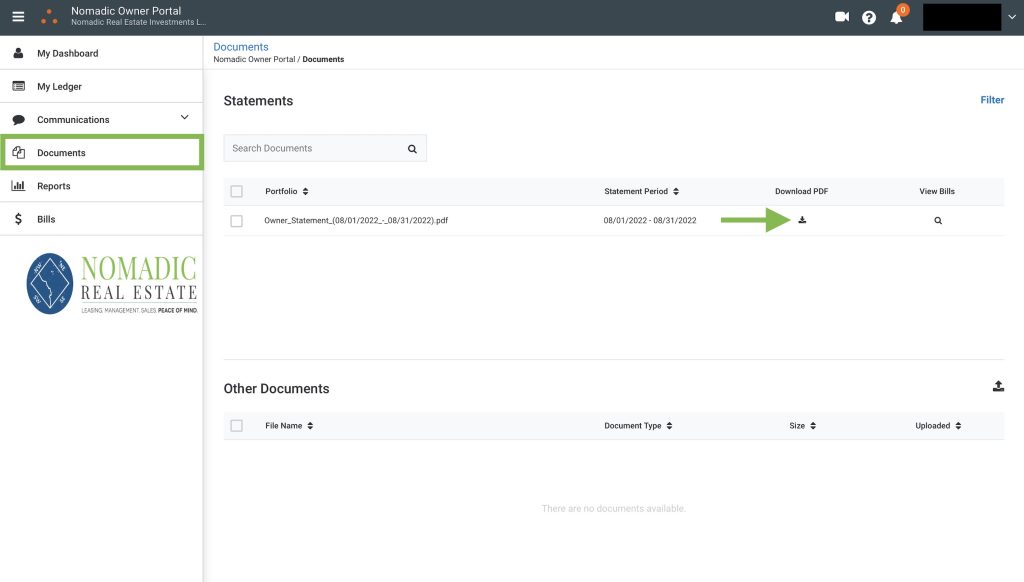
The Documents area contains monthly financial statements:

Owner Portal Documents
  • The statements in the Documents are are static documents. They are posted to the portal once a month to serve as a historical record of financial performance. 

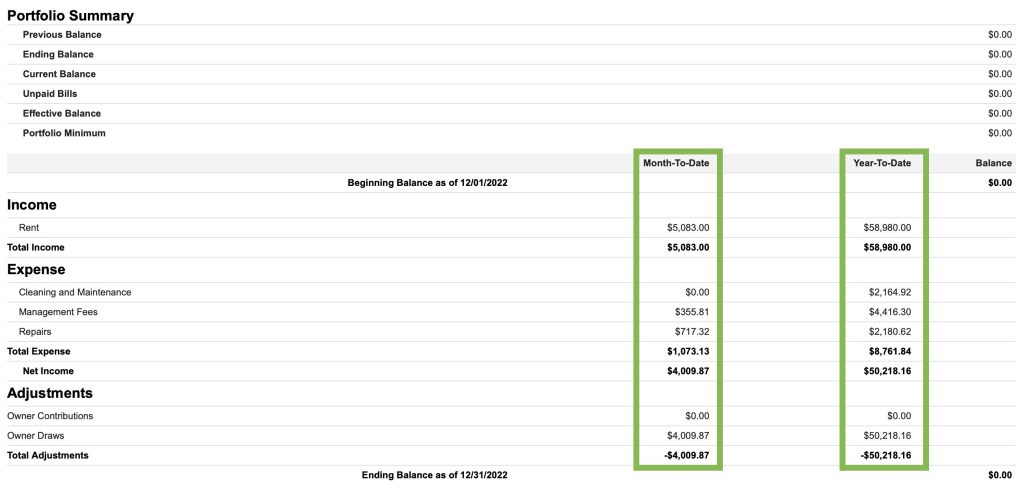
Download a statement to see month and YTD financials:

Owner Portal Property Statement

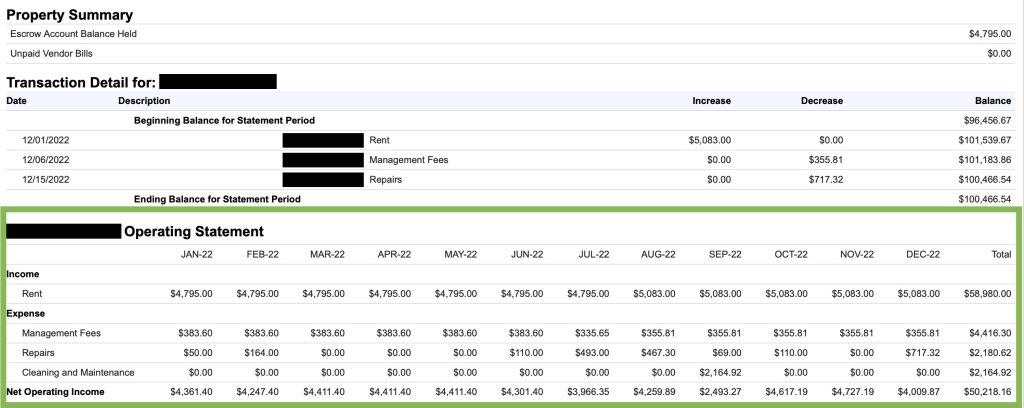
You'll also find a month-over-month operating statement:

Month over Month Statement

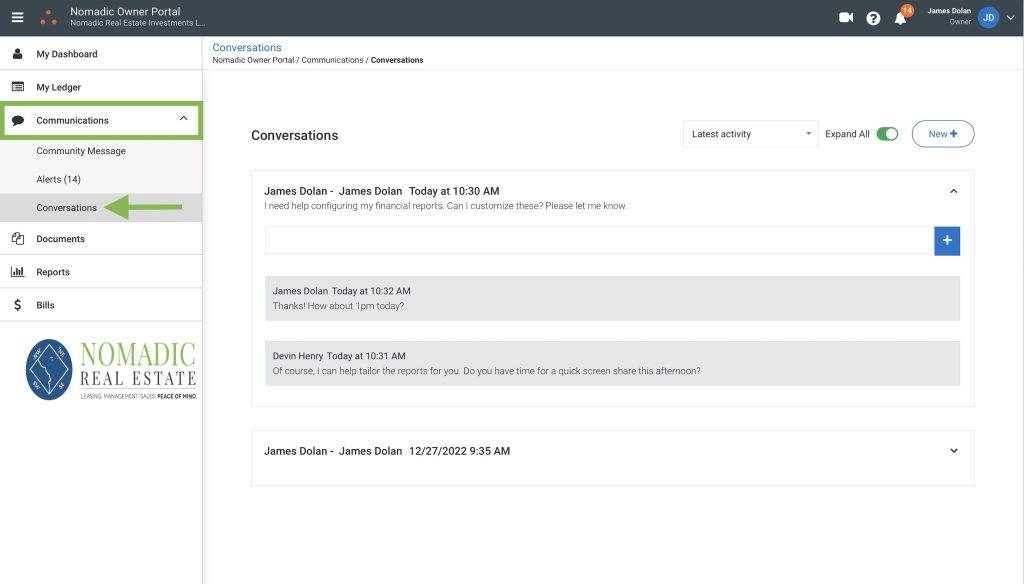
Portal Communication Tool

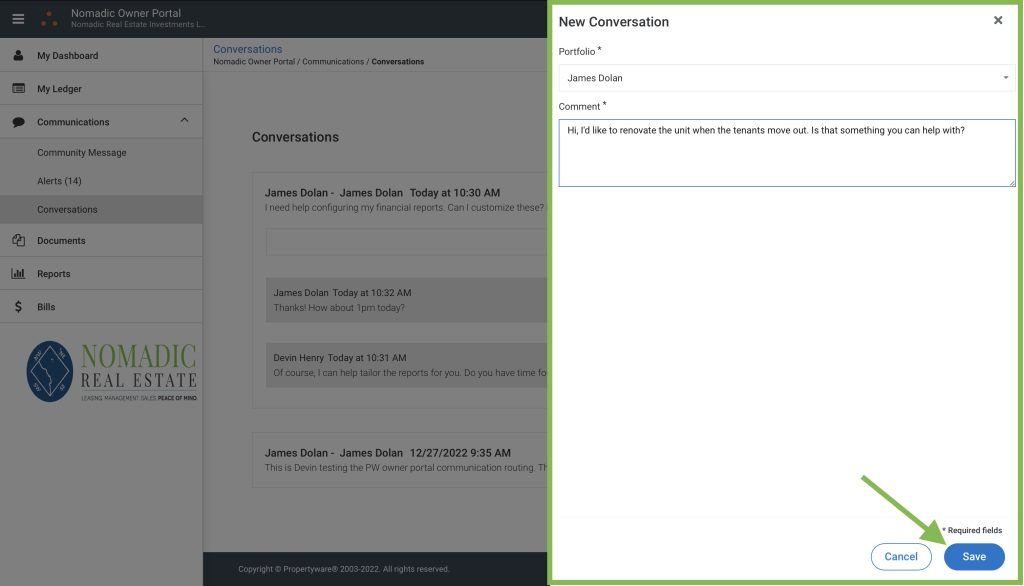
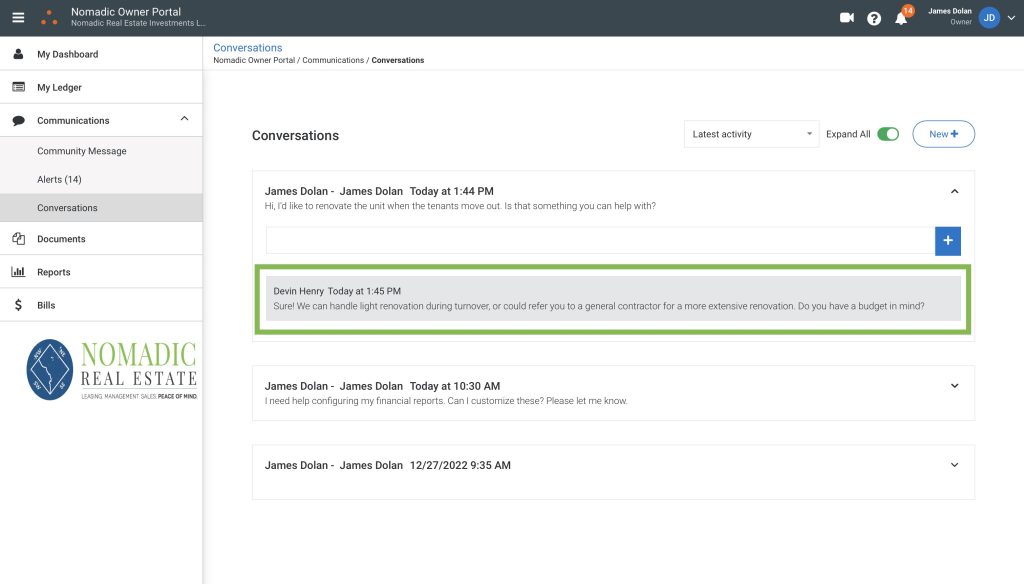
You can use your owner portal to communicate with our team. Any messages you send through the portal will go straight to your Account Manager. When we reply, you’ll get an email notification and you’ll also see the message in your portal next time you log in. 

Here’s an overview of using the communication platform:

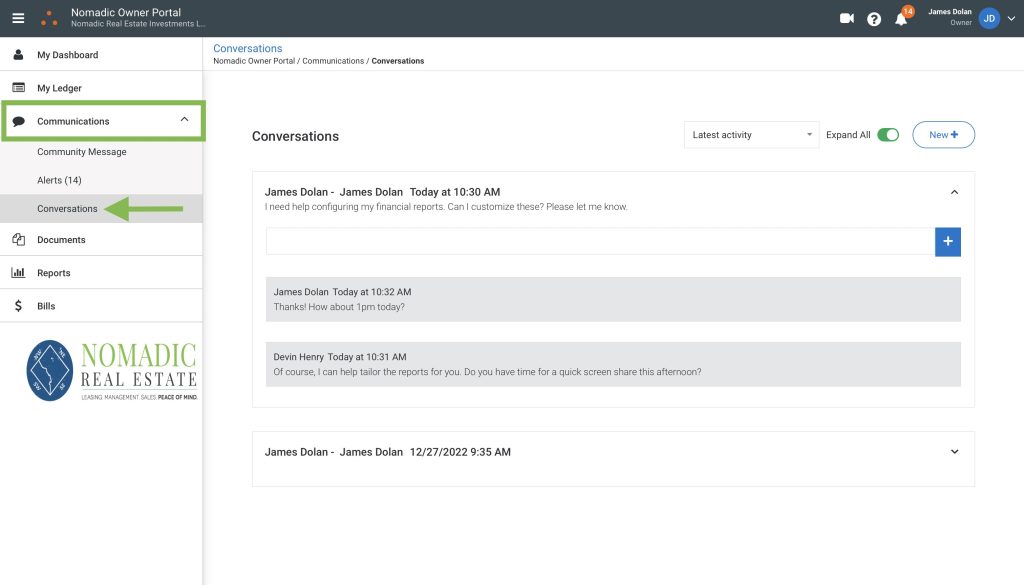
Click "Communications" and navigate to "Conversations":

Commincation Dashboard Screenshot
  • The communications module will contain a record of all messages that you create through the portal. 

Click the "New Message" button and send your message:

Owner Portal New Message Screenshot

Responses will show up in the conversation ticket:

Portal Conversation Response Screenshot
  • You’ll get an email notification whenever you get a response, and you’ll also see the message in your portal next time you log in. 

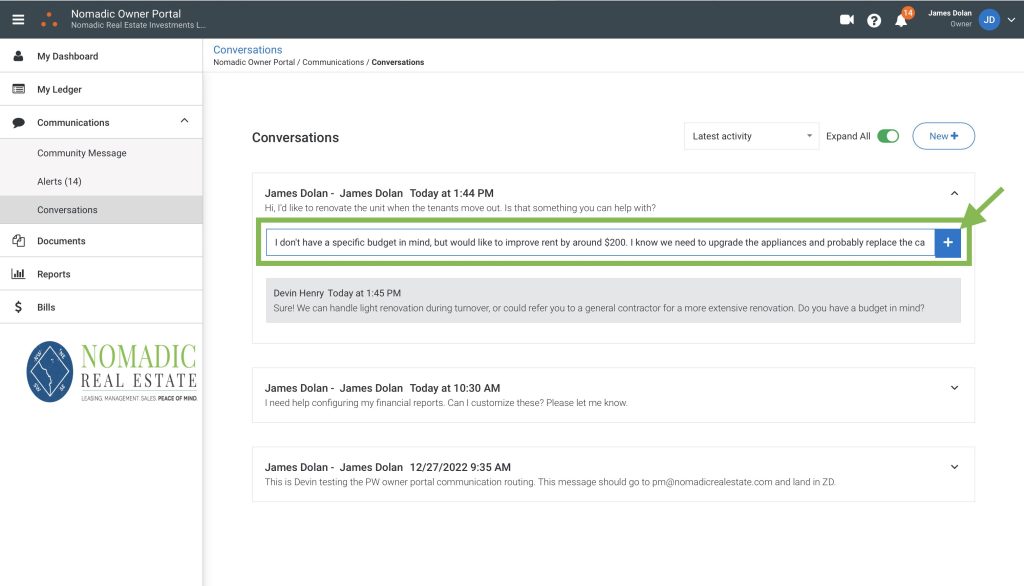
You can reply in-line using the comment box:

Owner Portal Comment

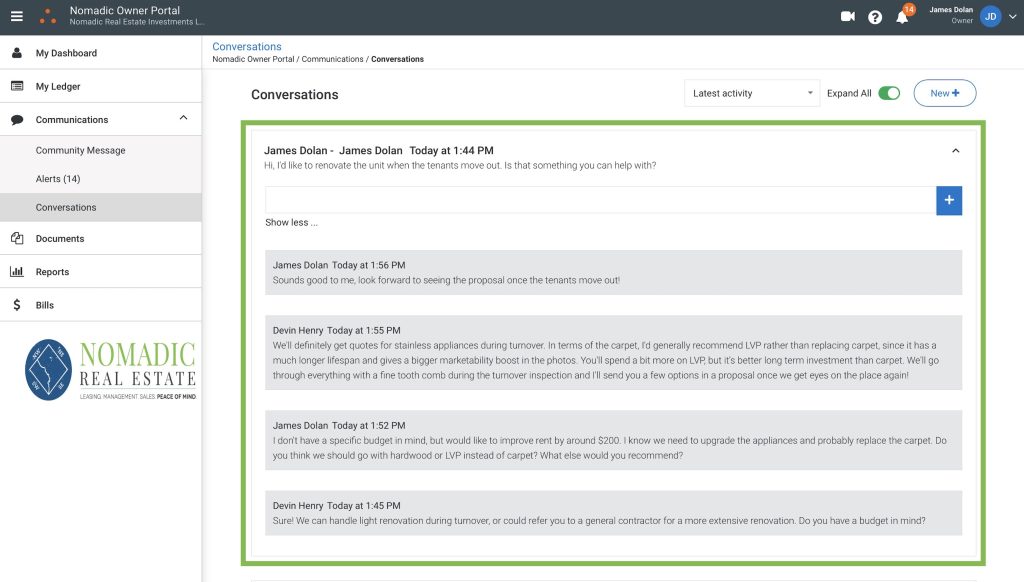
Each conversation will be logged in its entirety:

Portal Conversation Snapshot

Understanding the Ledger

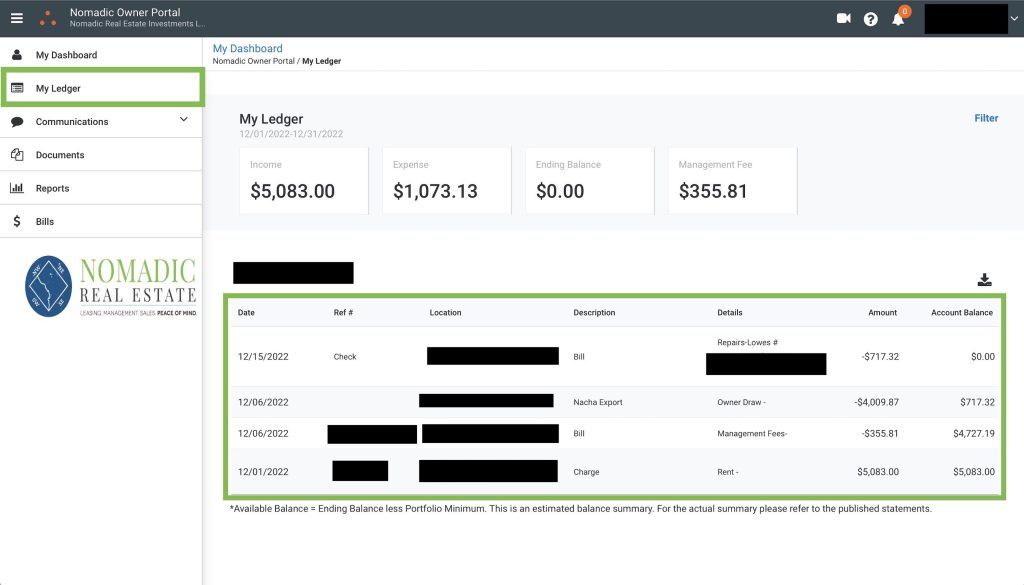
Your portal includes a ledger with all transactions. The ledger is populated with data in real-time as transactions flow through our accounting software. Much of this information is also available in the Reports area, as well as the Statements in your Documents library, but the ledger is the most comprehensive resource for diving into the details. 

Please scroll through the sections below to get a better understanding of how to interpret the ledger. 

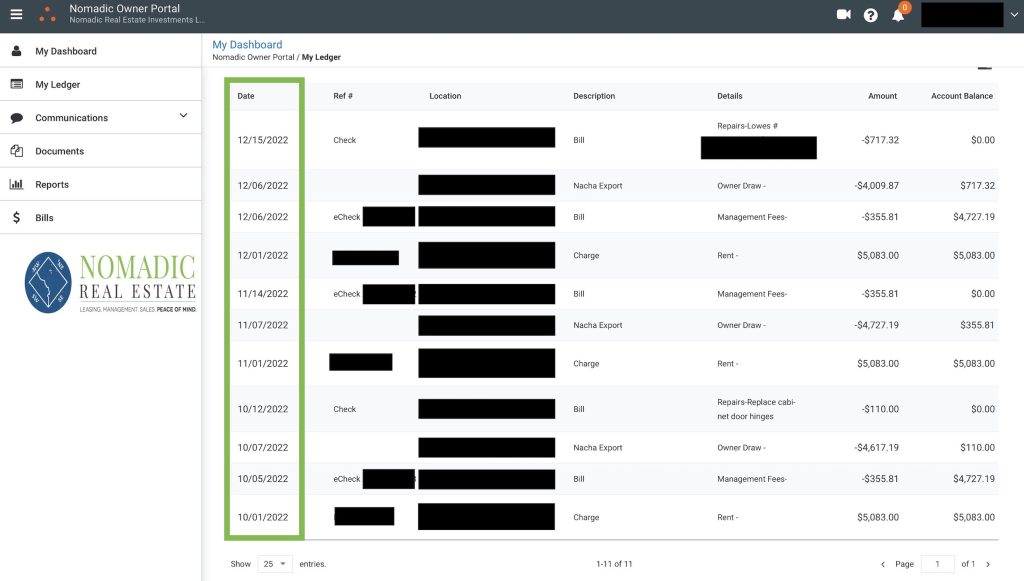
By default, transactions are sorted chronologically:

Owner Ledger Dates
  • The date reflected in the lefthand column is the actual transaction date, not the “bill date”. This is the date the transaction was actually processed. 

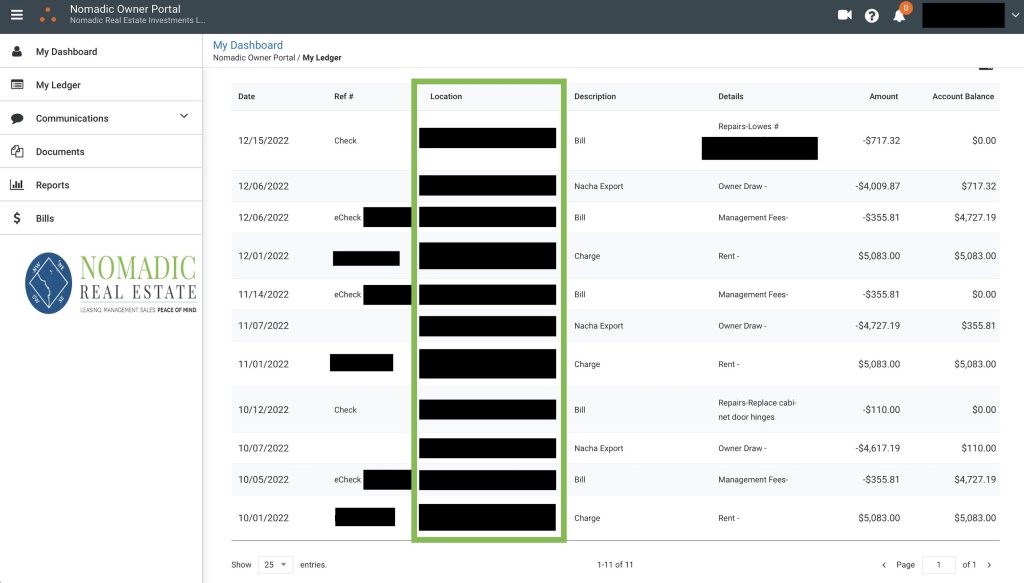
If you have multiple properties with Nomadic, you'll see the address for each transaction in the "Location" column:

Ledger Property Column
  • You can filter the ledger to look at just one property, all properties, or specific sets of properties. 
  • If you only have one property with us, you’ll just see the ledger for that property. 

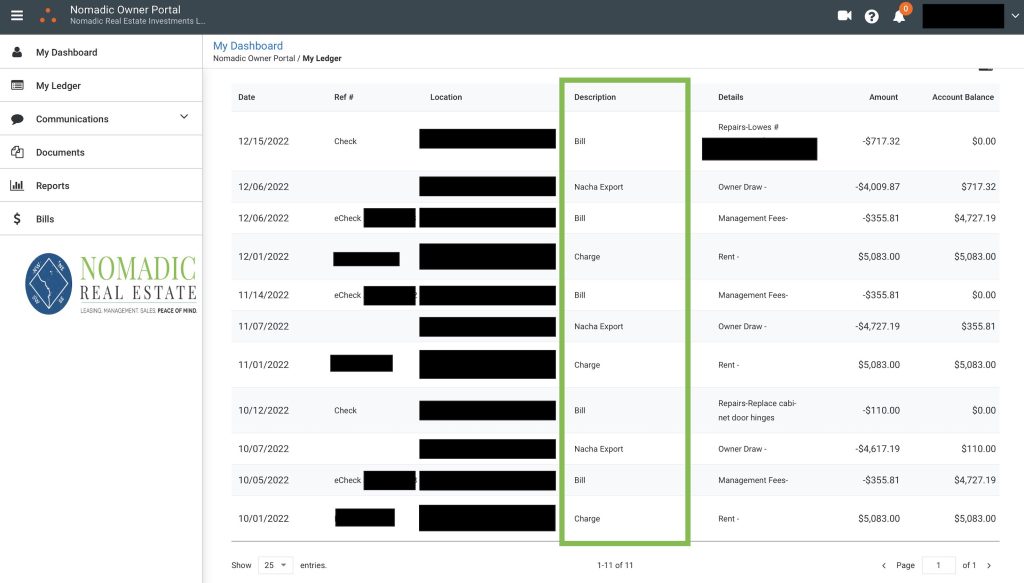
The Description column displays the transaction type:

Owner Ledger Description Column
  • BILL: this is an expense transaction, such as for repair costs or management fees.
  • CHARGE: this is a transaction  billed to the tenant, most typically a rent payment. 
  • NACHA EXPORT: this is a credit we processed to your distribution account. This type of transaction is how you get paid! 

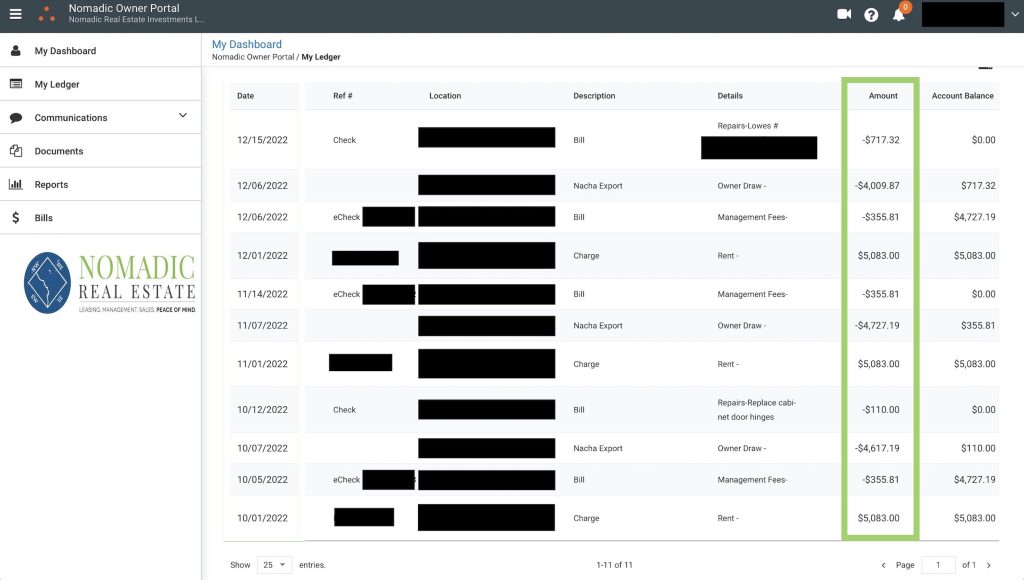
The Amount column shows the dollar value of each transaction:

Owner Ledger Amount Column
  • Positive Amounts: if an amount is positive, it reflects a transaction that is payable to you. Typically, this will be a rent payment that we collected from your tenants. On occasion, a positive number could also signify a journal entry or credit adjustment. 
  • Negative Amounts:  if an amount is negative, this is a transaction that is either payable to Nomadic or is an amount that has already been paid to you. Typically this will be for repair costs or management/leasing fees. Owner draws (net distributions into your checking/savings account) also reflect as negative amounts, since they have already been paid to you. 

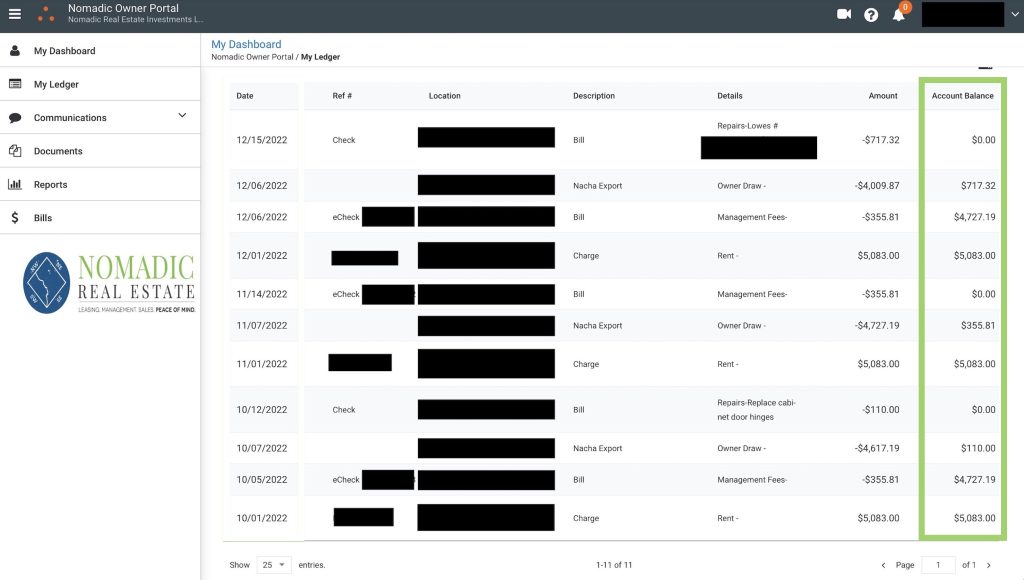
The Account Balance column shows a sum of positive/negative transactions at a given point in time:

Owner Ledger Account Balance Column
  • Account Balance should always equal zero after a net distribution has been processed. When the balance is zero, this means that all expenses have been paid and you’ve received the remainder as net operating income, leaving a balance of zero (meaning: no one is due any money, as all funds have been distributed appropriately). 

Navigating the Propertyware Owner Portal

Your portal includes some extremely useful features that help you understand your property’s financial performance at a new level, with real-time transparency into every transaction.

Scroll through the snapshots below for an overview of portal navigation! If you need more help or have specific questions about using the portal, you can reach out to your Account Manager any time for a screen share. 

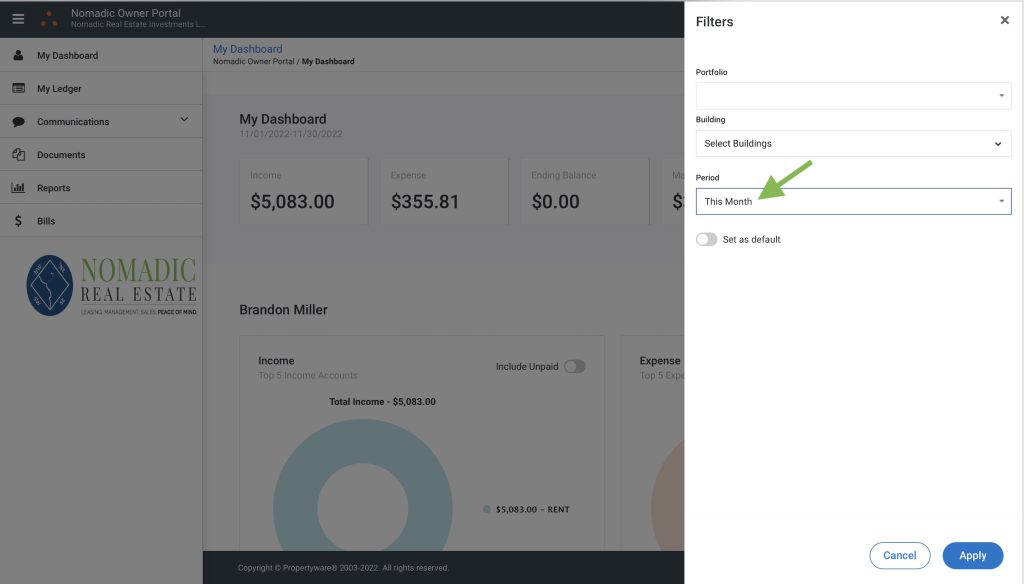
You can filter all info by date range or property:

PW Portal Filters

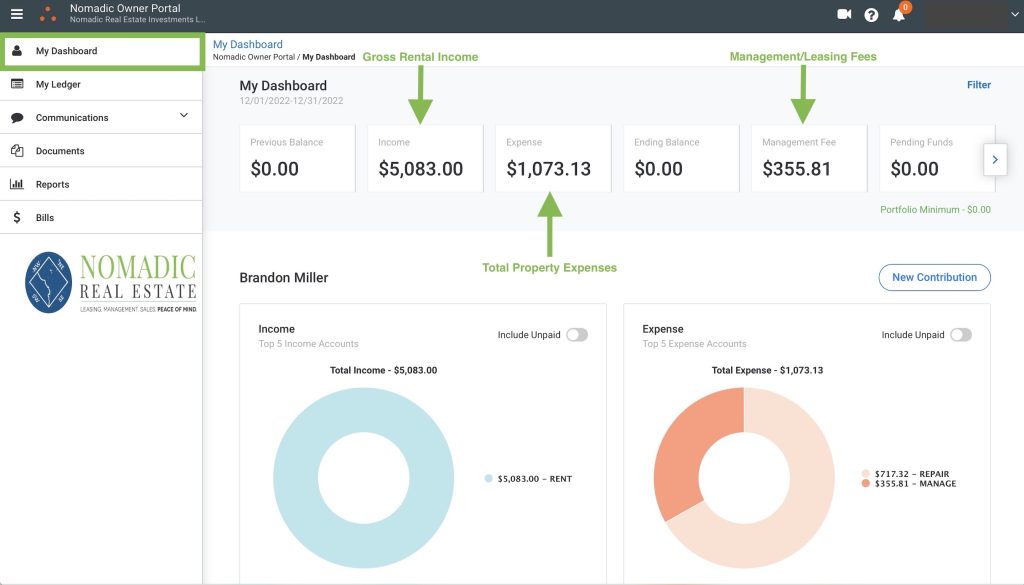
View a snapshot of income and expenses on your dashboard:

PW Owner Dashboard View

See every transaction in real-time on your ledger:

Owner Portal Ledger View

Statements and forms will be posted to your documents library:

Owner Portal Document Library

View a suite of real-time financial reports:

Portal Reports View

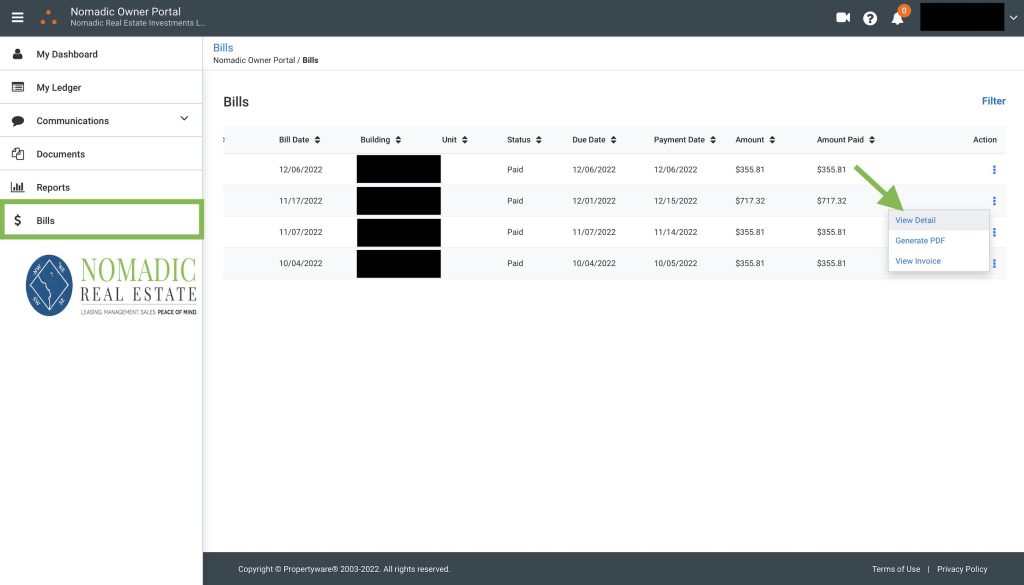
See a running list of all bills, and drill down for more detail:

Owner Portal Bills View

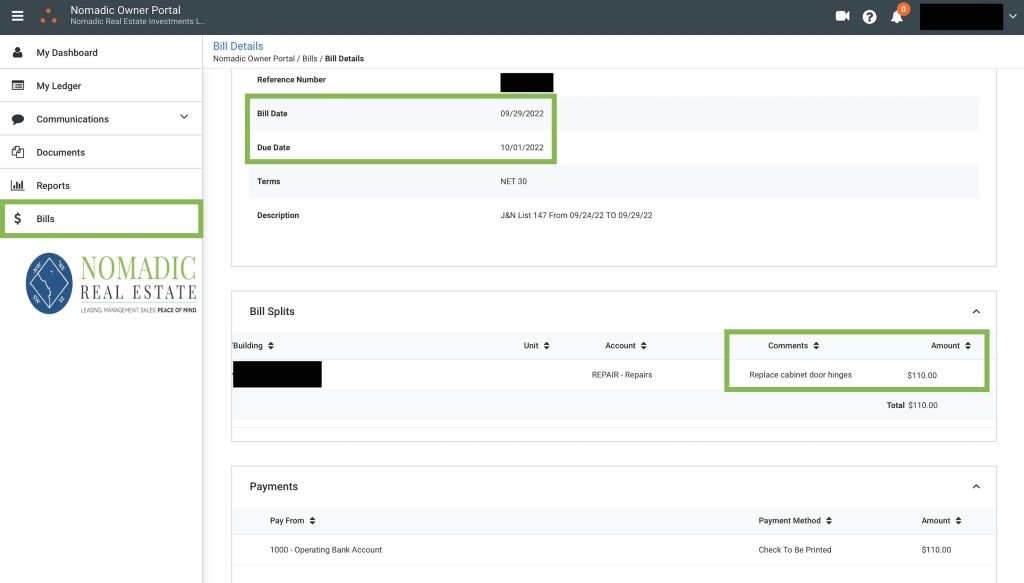
Under Bill Details, you'll find dates/descriptions/amounts and more:

Portal Bill Details

You can also communicate with your Account Manager through the portal:

Owner Portal Communication Tools

How do net distributions work?

Net distributions keep your accounting clean and simple. Each month we’ll collect rent from the tenants, deduct any repair expenses for the previous month and any management/leasing fees for the current month, and credit the remaining net operating income to your account. 

Net Distribution

You’ll receive a statement via email each time a net distribution is processed, and can view all transaction details in your Propertyware owner portal.